Prospects for Building & Construction Update of SA Reserve Bank and other data.
Â
Â
Â
Â
Â
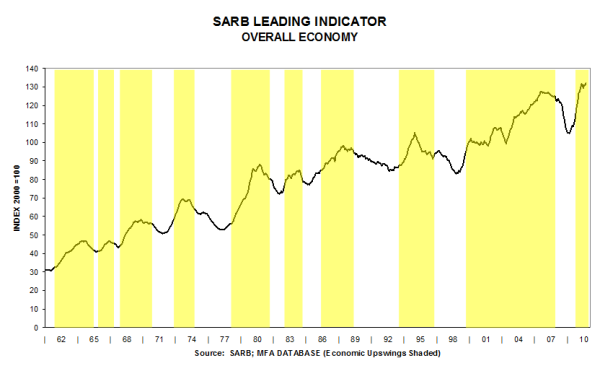
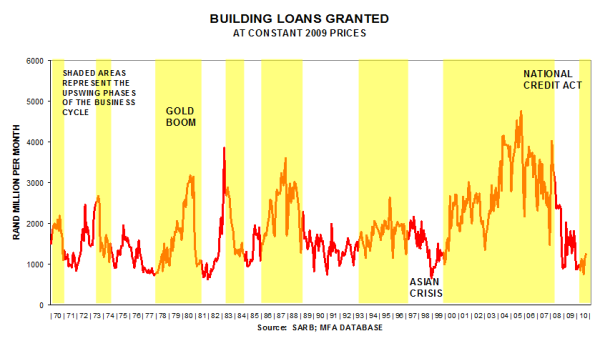
This key indicator is reflecting the slower growth rate in the macro-economy.
The vehicle market is outperforming the residential building market.
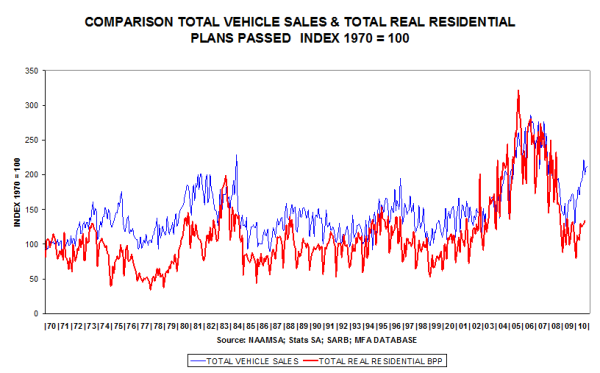
The vehicle market has had a burst of growth, but is now reflecting comparative base effects. It is conforming to the historical pattern.
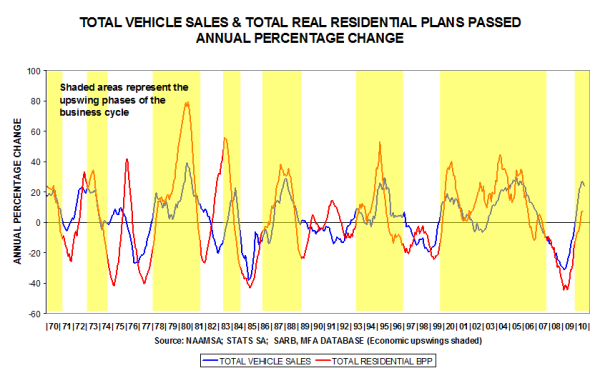
Private sector house plans passed are belatedly reacting positively to lower interest rates.
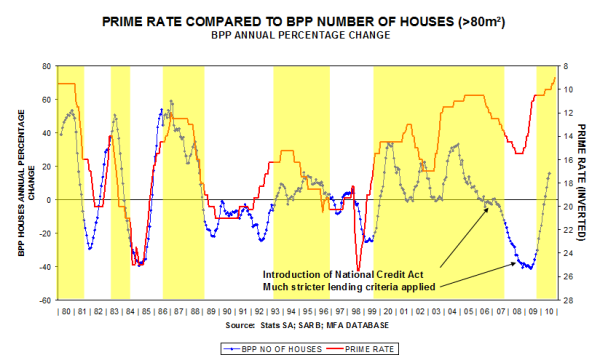
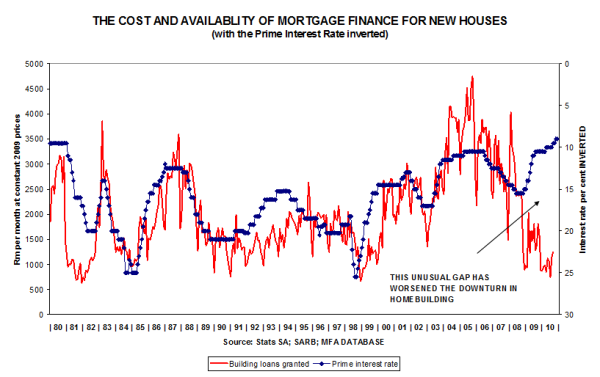
Mortgage loans for new houses have not yet responded positively to lower interest rates.
The cost of finance (the interest rate) has dropped, but the availability of housing finance is still bumping along the bottom. A possible reason could be the tight-fistedness of the banks.
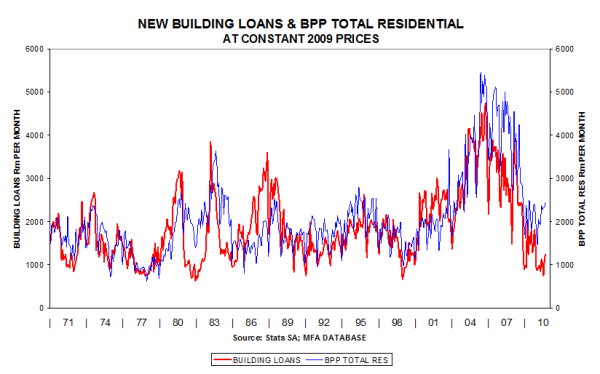
With the same value scales, it can be seen that residential plans passed have dropped less than building loans for new houses.
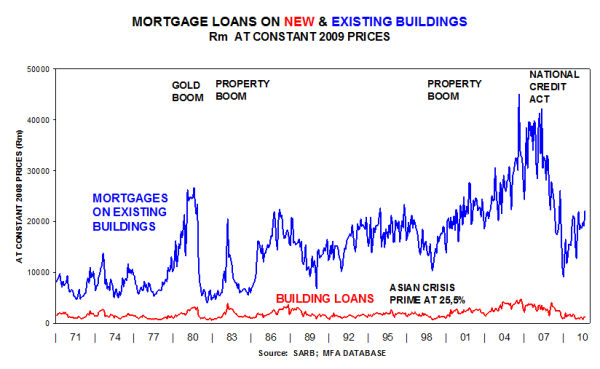
Mortgage loans for existing houses has staged a comeback, but not so in the case of new houses.
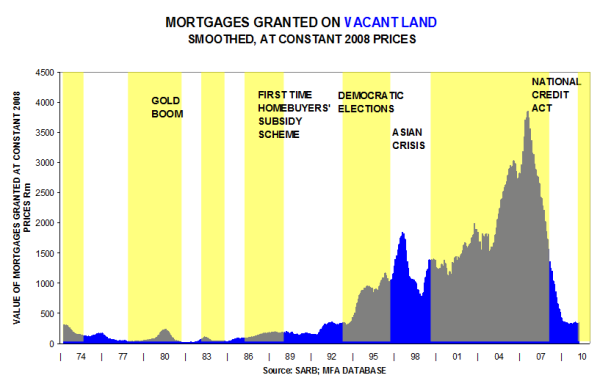
Mortgages granted for vacant land fell by about 90% from peak levels.
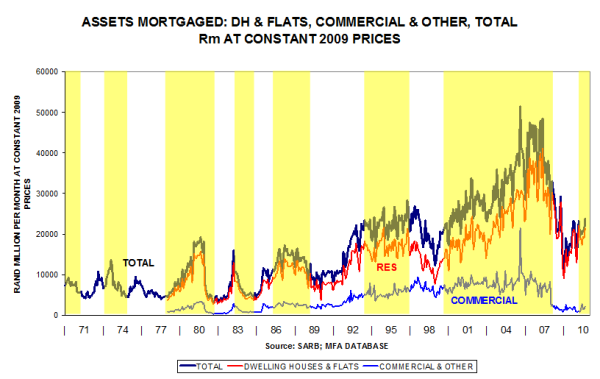
The commercial sector has dropped markedly.
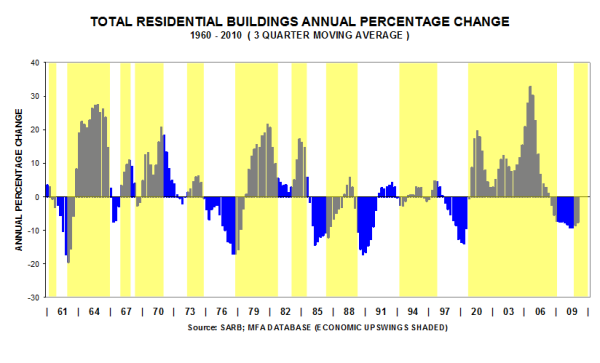
The peak was recorded in 2006, and 2010 could see the trough of the cycle.
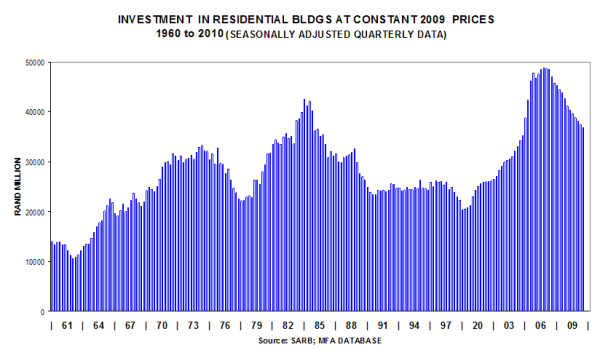
Conforming to pattern with the downturn slowly bottoming out.
The housing boom, 1999 – 2006, was financed largely on rising debt levels. With debt levels still high, no robust expansion is in the offing, therefore we foresee modest growth rates in housing demand.
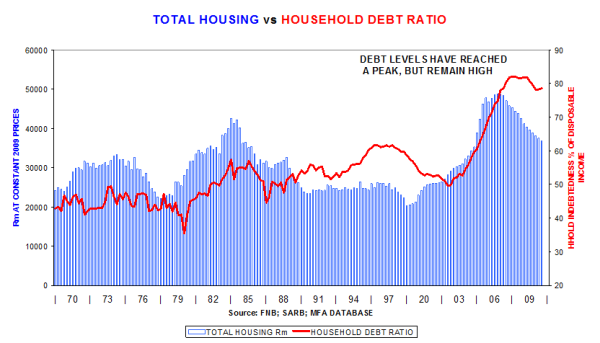
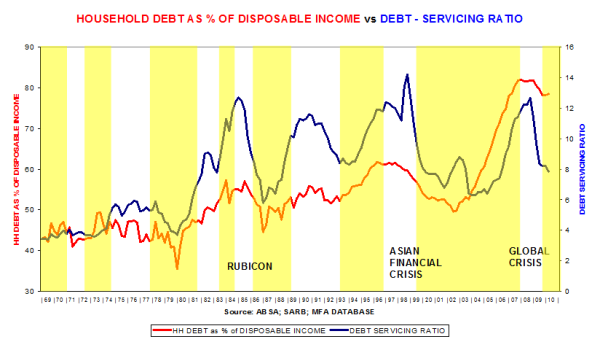
Debt servicing costs have declined because of a 6½ percentage point drop in interest rates, but debt levels remain high.
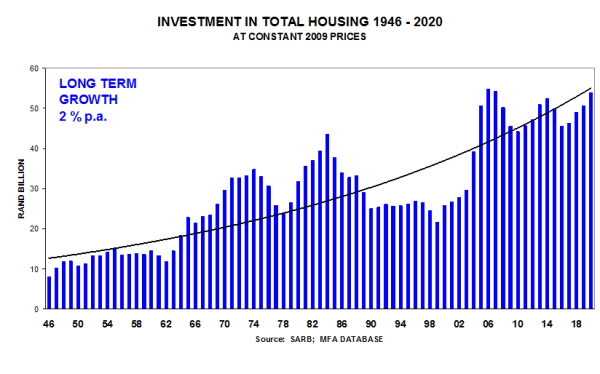
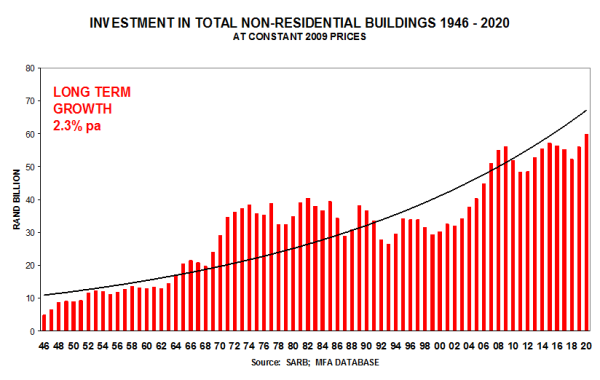
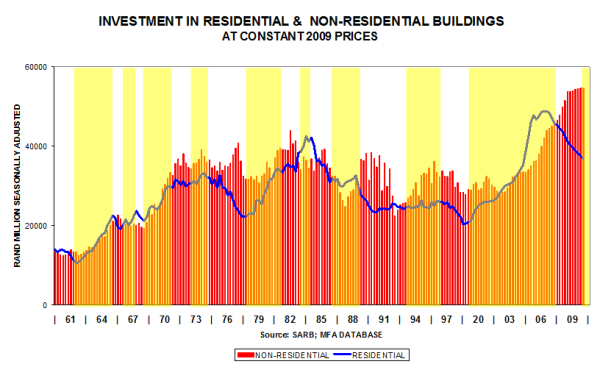
The housing market is currently smaller than the non-residential market (without taking the unrecorded housing sector into account).
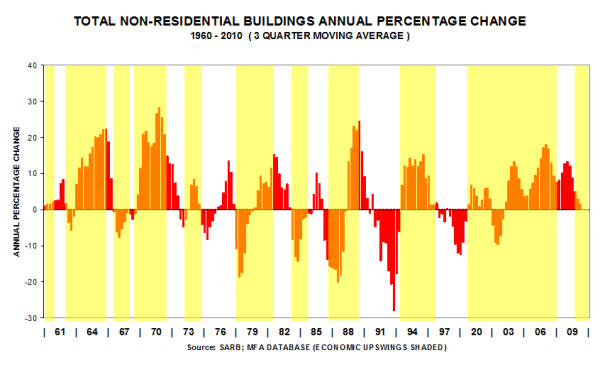
SA Reserve Bank figures are recording a peak.
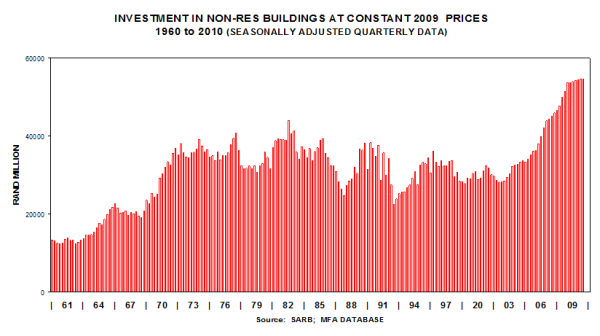
Conforming to pattern – still much further to drop from peak levels.
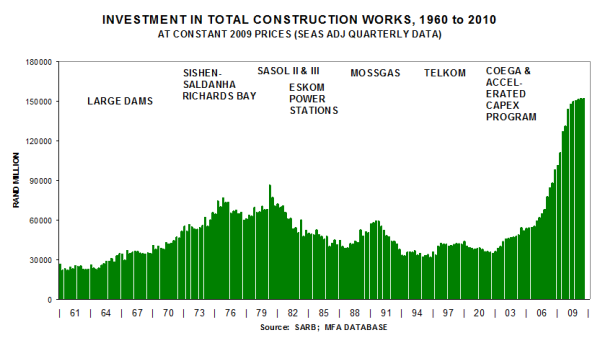
SA Reserve Bank figures show that a peak is being recorded.
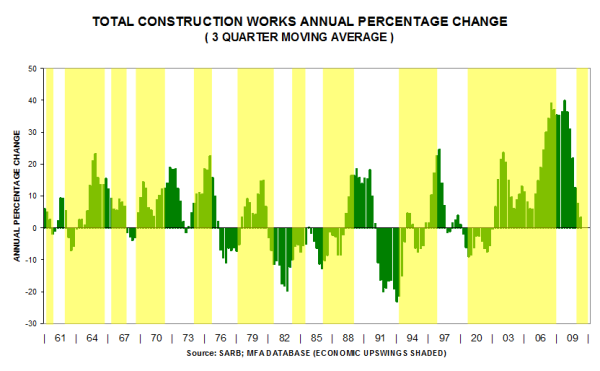
With growth rates falling rapidly.
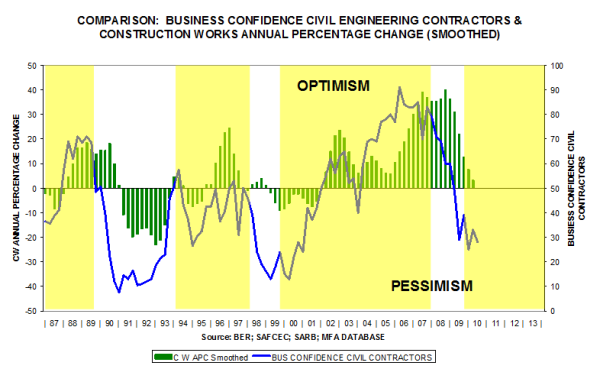
With growth rates in demand levels falling rapidly, civil engineering contractors are understandably pessimistic.
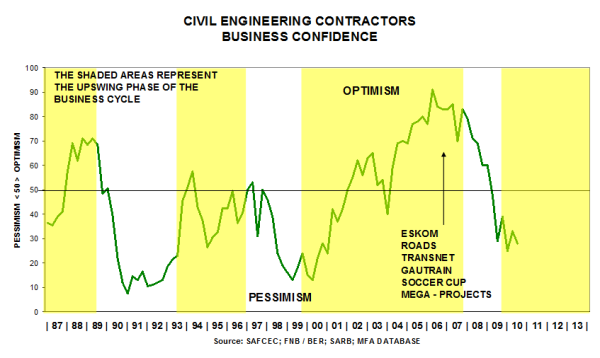
This graph below shows the close correspondence between declining activity levels and low business confidence.
Cement sales data have been released after a year during which the Competition Commission was investigating the cement companies for market-sharing irregularities.
In future, the Cement and Concrete Institute will be allowed to publish cement sales data for South Africa only (excluding Botswana, Namibia, Swaziland, Lesotho and export sales). This required us to adjust the historical data to keep the time series consistent.
No regional sales data are no longer available – a great loss to economic researchers.
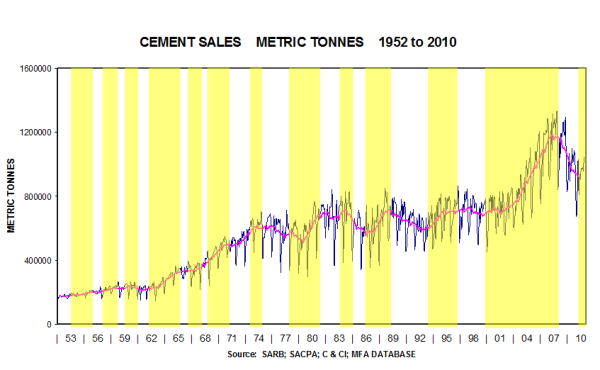
The accompanying MFA graph of the level of cement sales (1952-2010) shows how strong the upswing was during the recent construction boom. It also shows how severe the current downswing is. Indeed, volume sales have almost dropped back to the levels prevailing in 2004
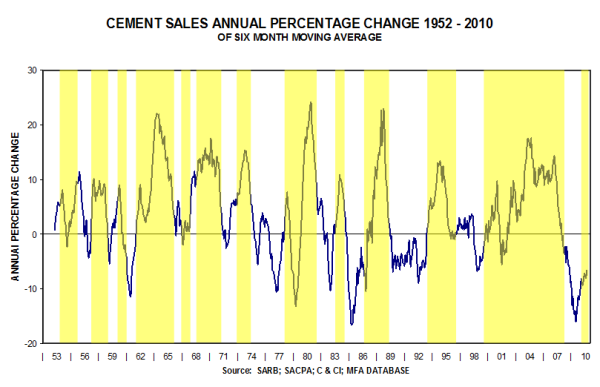
The graph of the year-on-year changes reflects two features: How regular the cyclical fluctuations are; and how severe the current downturn in sales really is. By comparison, volume sales have dropped in percentage change terms by as much as they did in 1985 at the time of the “Rubicon Recession”, i.e. by about -16% at its lowest point.
Cyclical swings are conforming to pattern and the current downturn is on a par with the 1985 recession.
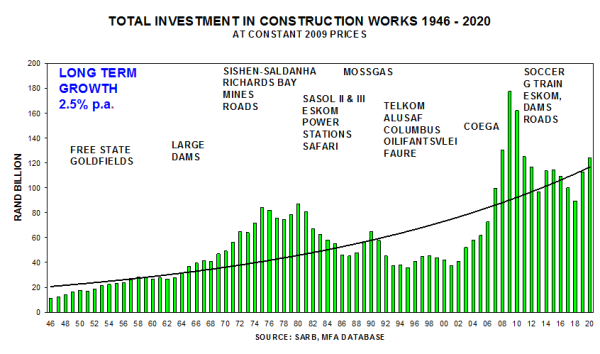
Long term view till 2020.