Leading Economic Indicators: Vehicle Sales & Transfer Duty

Written by  Dr Johan Snyman
Rate this item
(0 votes)
Leading Economic Indicators: Vehicle Sales & Transfer Duty Leading Economic Indicators: Vehicle Sales & Transfer Duty

Leading Economic Indicators: Vehicle Sales & Transfer Duty


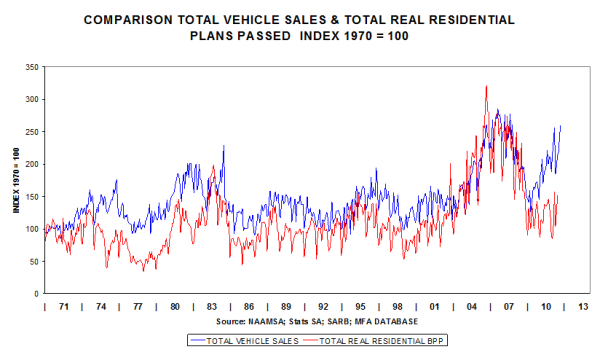
Total vehicle sales were 30% higher in Sep 2011, compared to Sep 2010.  Compared to Aug 2011, they were 5.7% higher, with purchasers by car rental companies responsible for a large part of this fine performance.

The cumulative 12 month moving total in Sep 2011 was 16.2% better.

VSTD1


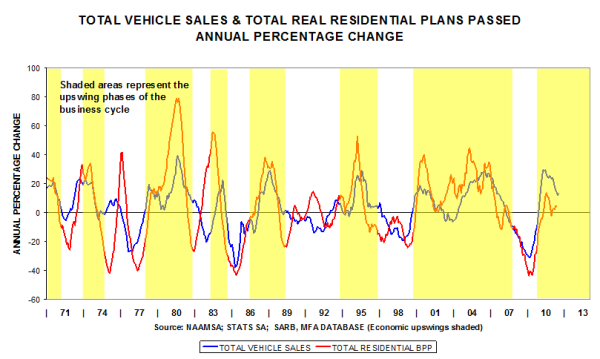
The annual percentage change of vehicle sales is currently 13.2% p.a.

VSTD2


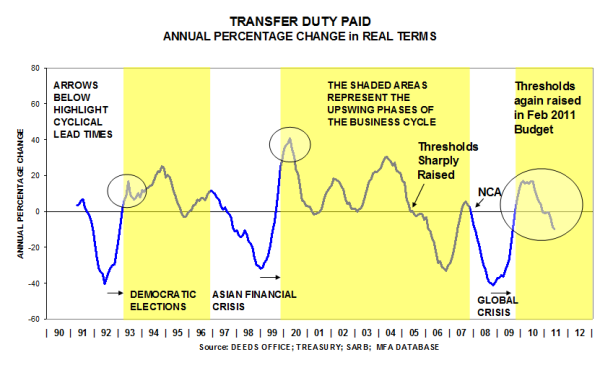
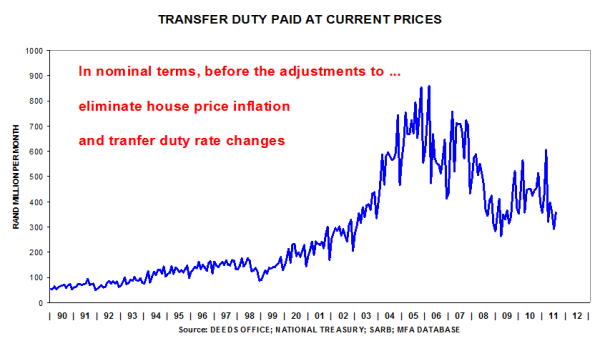
Although Aug 2011 data were somewhat better than July 2011 data, the poor state of the residential property market is currently being  reflected in low levels of transfer duty gathered by the fiscus.

VSTD3


In real terms the lacklustre performance is just as evident.  The level in Aug 2011 is just a tad better than in July 2011.
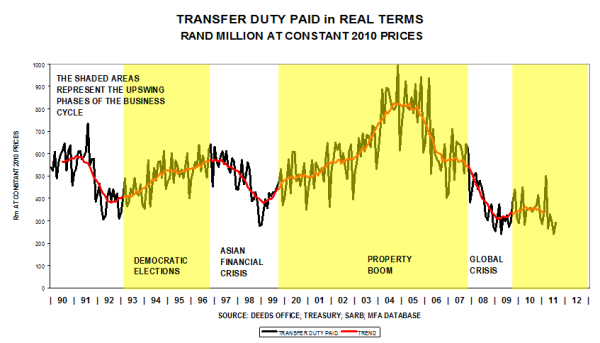
VSTD4


When analysing cyclical movements, transfer duty is down by 10% year-on-year.  Clear evidence of extreme weakness in the residential property market.

VSTD5

Dr Johan Snyman

Dr Johan Snyman

Johan Snyman obtained his BComm and MComm in Economics at the University of Stellenbosch, and complete his doctorate at the University of Cape Town.  He spent 8 years working as an economist at the Bureau for Economic Research, University of Stellenbosch and then established a private consulting firm, becoming Director of Medium-Term Forecasting Associates, a company specializing in research into building cycles and building costs.

In 2007 he was appointed Adjunct Professor in the Department of Construction Economics and Management at the University of Cape Twon.

Related items (by tag)

back to top