Total Vehicle Sales
According to the National Association of Automobile Manufacturers of South Africa (NAAMSA), total vehicle sales rose by 3.3%% when sales in June 2013 are compared to those recorded in June 2012.
When sales in June 2013 are compared to sales in May 2013, a drop of 1% is evident.
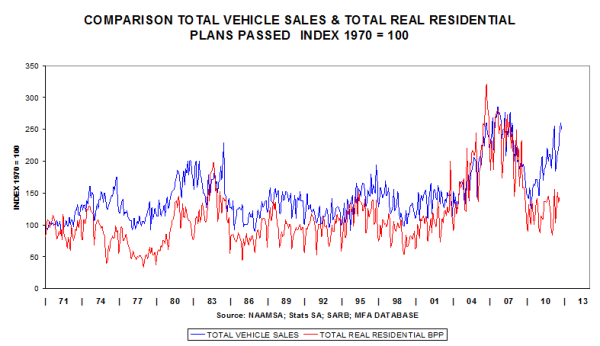
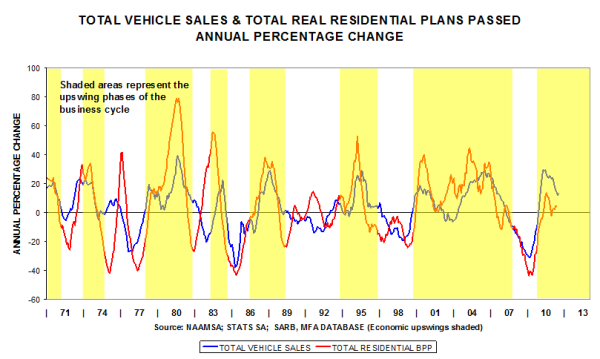
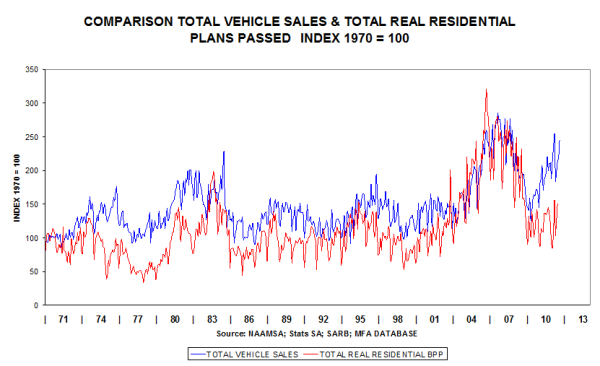
The graphs show the close correspondence in the cyclical movements of our two key indicators (vehicle sales and residential plans passed).
Banking economists tell us that credit advanced for vehicles is readily available because the interest rates charged are higher and the pay-back period is much shorter than for mortgage loans. Also, the amount of an individual loan is less, therefore the risk factor is smaller.
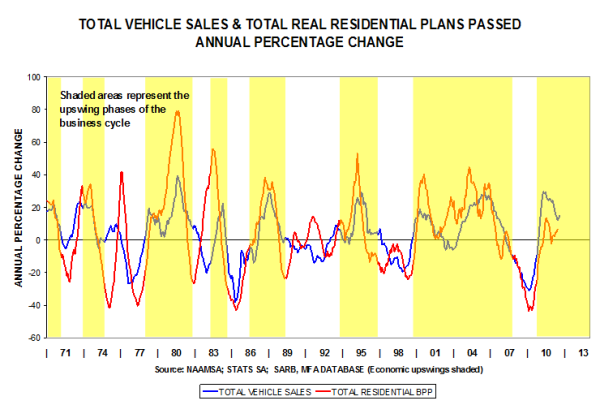
Observe the V-shaped recovery in total vehicle sales and the U-shaped movement in total residential plans passed. It seems as if vehicle sales is topping out.

Though the smoothed annual percentage movement of vehicles is still positive and fairly high at 6.7%, this growth rate is likely to drop further because current levels will be compared to high levels recorded a year ago (known as comparative base effects).


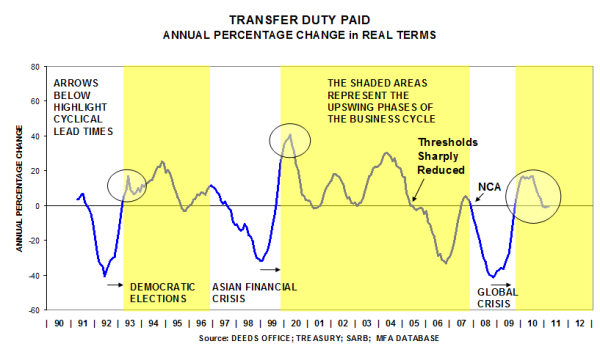
Transfer Duty Paid
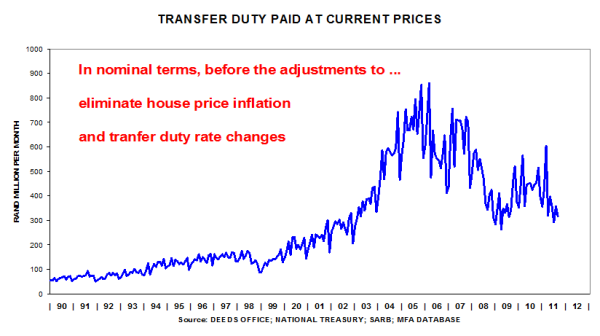
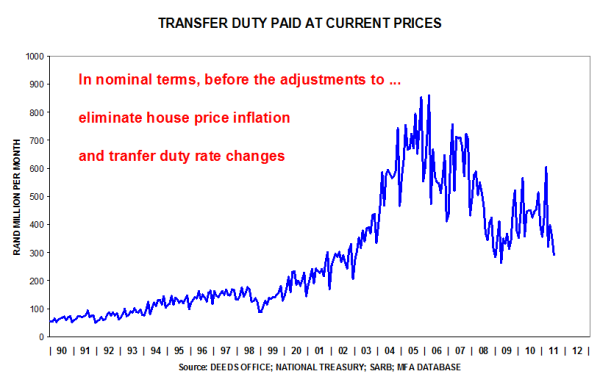
Transfer duty is payable when existing dwellings are purchased (on new houses, VAT is payable). Therefore, the cyclical movement in this particular tax can be regarded as a good proxy for the well-being of the residential property market.
To determine real trends, one needs to adjust the nominal values for house price inflation and for changes to the rate of transfer duty payable. At the moment the threshold for the payment of transfer duty relates to houses that change hands for more than R600 000. This threshold is meant to make it more affordable for middle class people to own their own home.
The three accompanying graphs, reflecting data up to May 2013 and show the following:
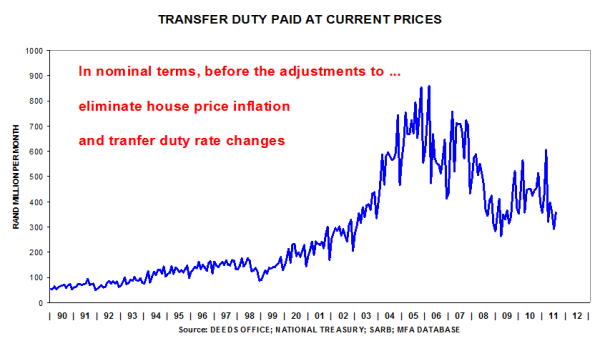
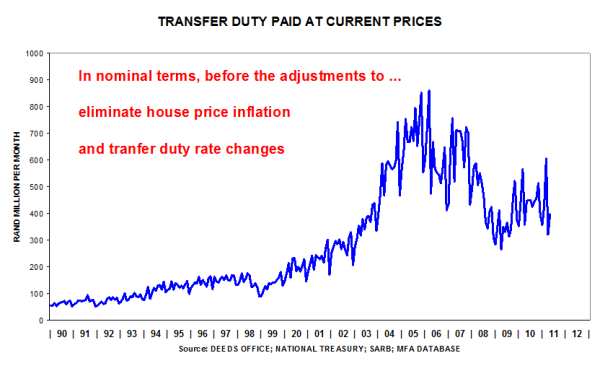
- That, in nominal terms, the level of the indicator has recovered from the December 2011 slump.
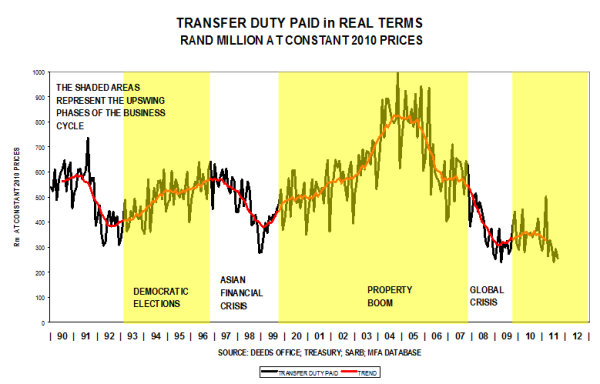
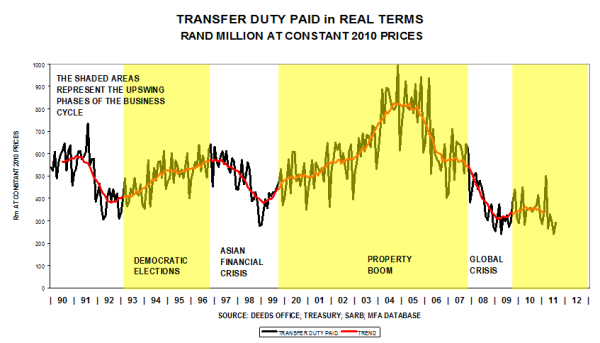
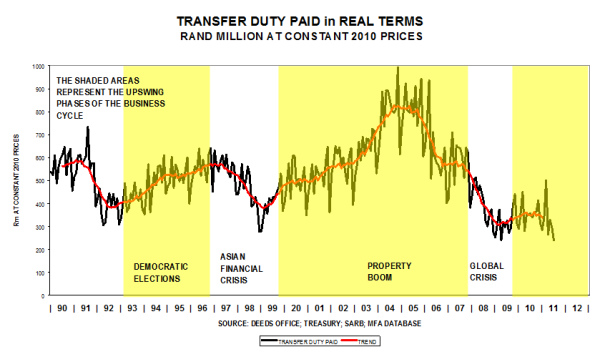
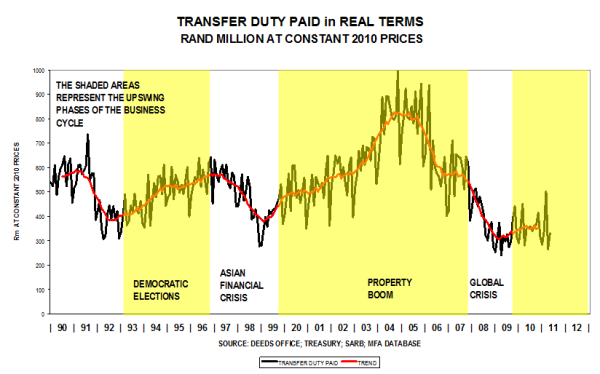
- That, in real terms (stripping inflation out and adjusting for transfer duty rate changes), a sharp rise in the level of transfer duty is evident.
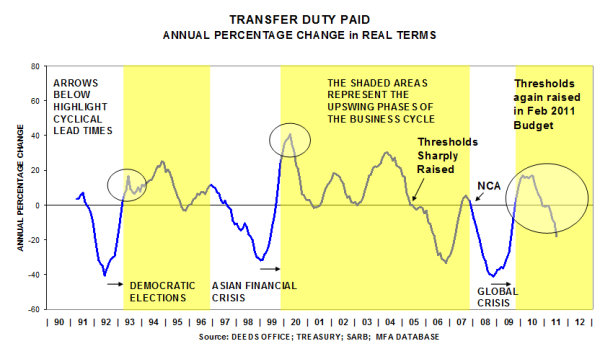
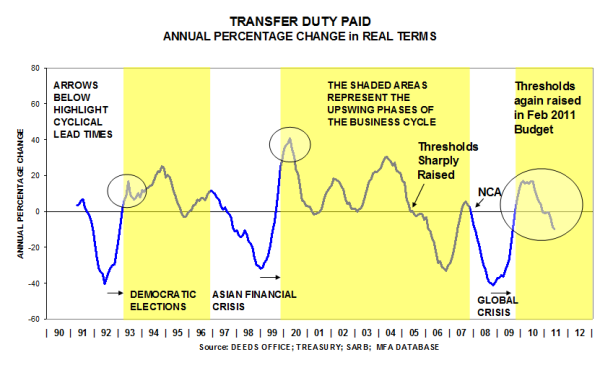
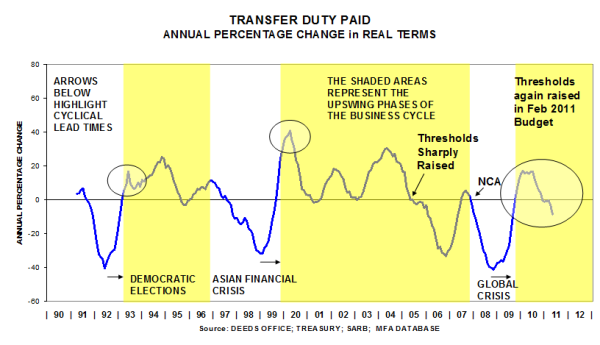
- That the real smoothed annual percentage change is currently 11.3%. This finding represents a dramatic improvement because the annual decline in January 2012 was -31.3%.
Due to the drop in mortgage rates during July 2012, it is quite likely that this indicator could improve further in coming months, reflecting better business conditions in the residential property market. We expect this revival to be modest because of the still high debt levels of consumers and low growth in mortgage lending figures.


One can assume that most existing dwellings are financed with mortgage bonds.Because both indicators are related to the residential property market, one could reasonably expect that movements in mortgages advanced for dwellings could be closely linked to movements in transfer duty paid.
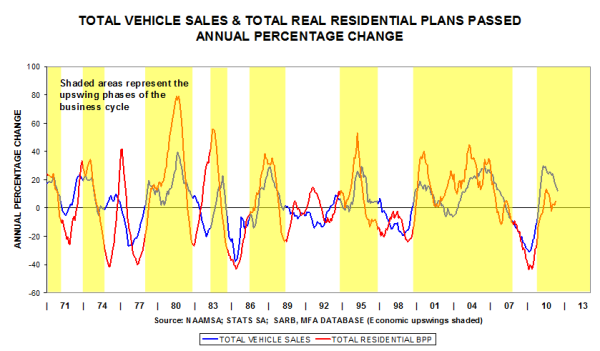
It makes sense to compare these two indicators that function as proxies for the well-being of the residential property market. Observe in the next graph that the cyclical movements, expressed as annual percentage changes, are remarkably close.
Where the correspondence is not that close, the divergence can be explained by means of changes to transfer duty rates or increases in threshold levels (e.g. 2005, resulting in a loss to the Fiscus).One can also observe the dramatic drop in these key indicators during the global financial crisis of 2008/09. During this period the residential property market suffered severely.
Recent trends are positive and it looks like national market conditions are improving. There is clear evidence that the market has finally turned. Observe that the Transfer Duty Paid indicator is in positive territory, but that the movement in Loans Granted has turned negative.
There is a publication lag of three months, with Loans Granted being the lagging indicator. Weak loans data in July-Sep 2012 could explain this divergence. The latest data to March 2013 suggest that Loans granted could be turning the corner.


Transfer duty is payable when existing dwellings are purchased (on new houses, VAT is payable).
Therefore, the cyclical movement in this particular tax can be regarded as a good proxy for the well-being of the residential property market.
To determine real trends, one needs to adjust the nominal values for house price inflation and for changes to the rate of transfer duty payable.
At the moment the threshold for the payment of transfer duty relates to houses that change hands for more than R600 000.
This threshold is meant to make it more affordable for middle class people to own their own home.
The following 3 graphs, reflecting data up to November 2012, show the following:
- That, in nominal terms, the level of the indicator has recovered from the December 2011 slump.
- That, in real terms (stripping inflation out and adjusting for transfer duty rate changes), a sharp rise in the level of transfer duty is evident.
- That the smoothed annual percentage change has risen to 16%. This finding represents a dramatic improvement because the annual decline in January 2012 was -31.3%.
Due to the drop in mortgage rates during July 2012, it is quite likely that this indicator could improve further in coming months, reflecting better business conditions in the residential property market. We expect this revival to be modest because of the still high debt levels of consumers and low growth in mortgage lending figures.


NCA = National Credit Act Implemented July 2007
One can assume that most existing dwellings are financed with mortgage bonds.
Because both indicators are related to the residential property market, one could reasonably expect that movements in mortgages advanced for dwellings could be closely linked to movements in transfer duty paid.
It makes sense to compare these two indicators that function as proxies for the well-being of the residential property market.
Observe in the next graph that the cyclical movements, expressed as annual percentage changes, are remarkably close. Where the correspondence is not that close, the divergence can be explained by means of changes to transfer duty rates or increases in threshold levels (e.g. 2005, resulting in a loss to the Fiscus).
One can also observe the dramatic drop in these key indicators during the global financial crisis of 2008/09. During this period the residential property market suffered severely.
Recent trends are positive and it looks like national market conditions are improving. There is clear evidence that the market has finally turned.


The revenue raised by the Fiscus from Transfer Duty Paid is a reflection of the well-being of the residential property market. This is the case because transfer duty is gathered by conveyancers (on behalf of the Receiver of Revenue) when existing houses are bought and sold (new houses are subject to VAT).
To assist middle-class people to purchase a home, the Minister of Finance raised the threshold at which point transfer duty is payable, from R500 000 to R600 000. This happened in February 2011 at the time of the national budget.
The latest figure for Dec 2011 was much lower than in Nov 2011, and a lot lower than in Dec 2010 if one eliminates the seasonal effect. Overall, the proceeds from transfer duty were R5 302m in 2010 and R4 272m in 2011.
This represents a decline of -19.4%, a severe drop in revenue from this source.
Our 3 accompanying slides show the following:
- That in nominal terms the level has dropped below that prevailing in 1998 at the time of the Asian financial crisis
- That in real terms (stripping inflation out and adjusting for transfer duty rate changes), the level is at its lowest point since the time series started in 1990
- That the annual percentage change is currently -31% lower than a year ago.
Based upon this analysis, it seems that the volume of sales of existing residential units shrunk during the latter part of 2011. This had a negative knock-on effect on transfer duty paid by new homeowners. One can therefore expect no further concessions from the Minister of Finance in the upcoming budget on 22 February 2012.


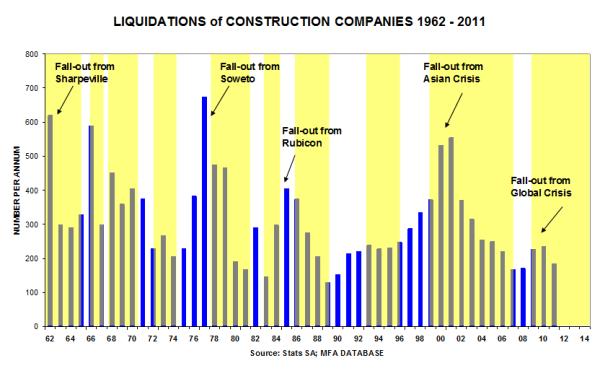
These data include both voluntary and compulsory liquidations of construction companies during the period 1962 to 2011.
The accompanying graph has shaded areas that represent the upswing phases in the overall business cycle.
Observe that, in most cases, the numbers of liquidations drop during growth periods and rise during economic recessions.
However, as liquidations can take a while to be wound up, the numbers even rise during the early part of a growth phase in certain instances. In such cases they lag the cycle.
The drop in liquidations in 2011, compared to 2010, suggests that the worst is over for construction companies still hamstrung by the low level of building demand. This finding comports with rising building costs as competition in tendering eases.

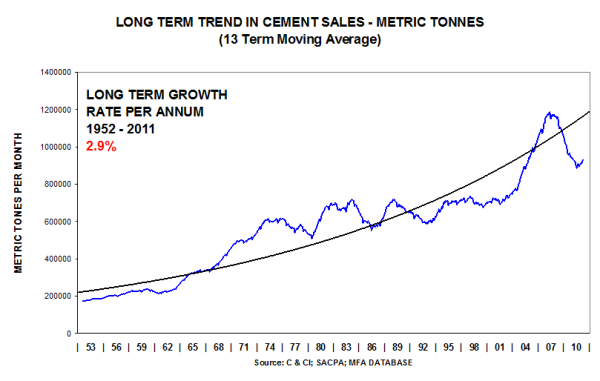
Cement sales for October 2011
Cement sales in OCT 2011 were 10.3% higher than in OCT 2010 (with equal trading days).
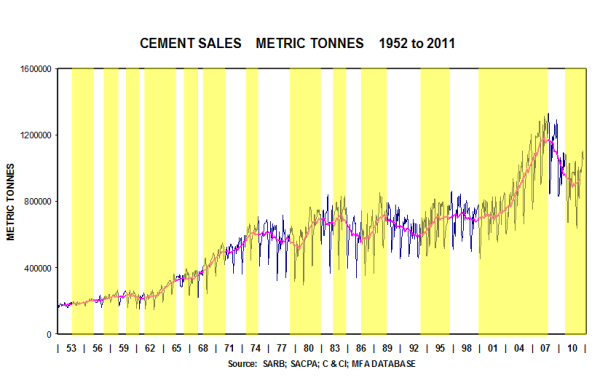
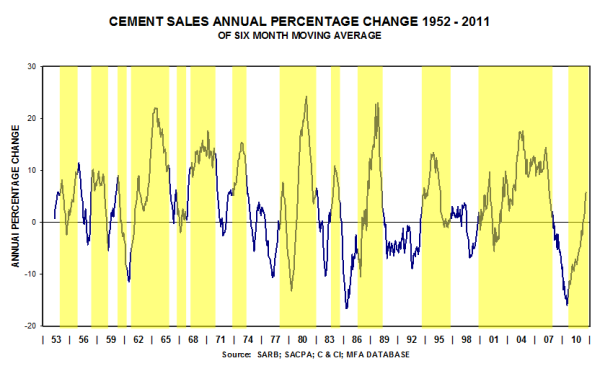
On a year-on-year basis, the (smoothed) Annual Percentage Change was +6%.
This graph shows the long-term trend.
The next graph compare the annual percentage change in cement sales with the annual percentage change in the average of the time series Total Building Plans Passed and Total Buildings Completed. The fit looks pretty good, keeping in mind that cement is also sold into the construction works market (not reflected in either BPP or BC).
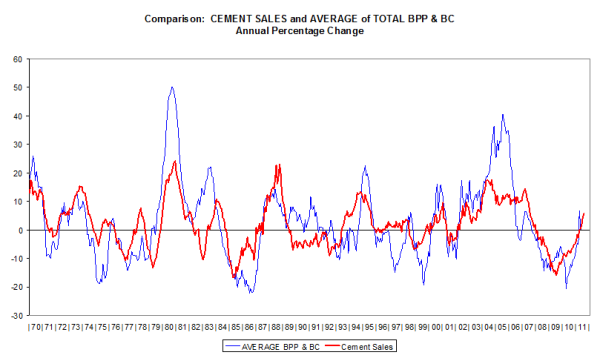
We expect a modest percentage revival (single digits) in cement sales during 2011/12.

Vehicle Sales & Transfer Duty November 2011.
Total vehicle sales were 19% higher in Oct 2011, compared to Oct 2010. Compared to Sep 2011, they were 4% lower.
The (smoothed) annual percentage change of vehicle sales is currently 15%, and is a mirror image of plans passed, albeit on a higher plane.
The poor state of the residential property market is reflected in poor nominal levels of transfer duty gathered by the fiscus
In real terms the lacklustre performance is just as evident. Real levels are now on a par with those prevailing during the 2008/09 financial Crisis.
When analysing year-on-year changes, the cyclical pattern is evident, except that the percentage movement is currently negative, compared with smaller positive movements in 1993 and in 2000 (refer circles). More evidence of extreme weakness in the residential property market. In fact, the percentage decline is severe, at -18%.
Leading Economic Indicators: Vehicle Sales & Transfer Duty
Total vehicle sales were 30% higher in Sep 2011, compared to Sep 2010. Compared to Aug 2011, they were 5.7% higher, with purchasers by car rental companies responsible for a large part of this fine performance.
The cumulative 12 month moving total in Sep 2011 was 16.2% better.

The annual percentage change of vehicle sales is currently 13.2% p.a.
Although Aug 2011 data were somewhat better than July 2011 data, the poor state of the residential property market is currently being reflected in low levels of transfer duty gathered by the fiscus.
In real terms the lacklustre performance is just as evident. The level in Aug 2011 is just a tad better than in July 2011.
When analysing cyclical movements, transfer duty is down by 10% year-on-year. Clear evidence of extreme weakness in the residential property market.

Underneath is our interpretation of buoyant vehicle sales figures and poor transfer duty paid figures.
The latter reflects the poor state of the residential property industry. These divergent trends (i.e. positive in the case of vehicles sold, and negative in the case of the residential property market) suggest that consumers are buying vehicles, but not houses. According to banking economists, the banks enjoy larger profit margins on vehicle finance and credit card debt than on mortgage advances, and the payback period is shorter. Thus, banks have become more selective in their lending behaviour.
Total vehicle sales were 12% higher in Aug 2011, compared to July 2011. Compared to Aug 2010, they were 11% higher.
The annual percentage change of vehicle sales is currently 12%, reflecting the typical cyclical pattern evident in 1973, 1979, 1995 and in 2000 (i.e. a sharp rebound from a low level, then a moderation in the cyclical movement that is due to comparative base effects. This means that current high levels are being compared to growing levels a year ago).
The poor state of the residential property market is reflected in poor levels of transfer duty gathered by the fiscus.
In real terms the lacklustre performance is just as evident. The level in July 2011 is exactly equal to the low point recorded in April 2009 during the global financial crisis.
When analysing year-on-year changes, the cyclical pattern is evident, except that the percentage movement is currently negative, compared with smaller positive movements in 1993 and in 2000 (refer circles). More evidence of extreme weakness in the residential property market.

Transfer Duty July 2011
In nominal terms, May 2011 data were better than in April 2011, but the property market is still suffering from lack of mortgage finance from banks.
In real terms, the trend is virtually sideways.
The annual percentage change is nudging the zero line, implying that real levels are the same as a year ago.