
1. WHAT IS 'MARKETING'?
The Chartered Institute of Marketing defines marketing as "the management process responsible for identifying, anticipating and satisfying customer requirements profitably".
Sellers and buyers alike are 'consumers' of estate agency services.
2. WHO IS AN ESTATE AGENT'S TARGET MARKET IN RESPECT OF THE MARKETING AND ADVERTISING OF ITS SERVICES?
The target market of the services of estate agents is buyers and sellers of property.
When it markets its services to sellers, it does so with the view to securing a mandate to sell a property.
When an Multi-Listing estate agent markets a Multi-Listing Mandate, it does so on the basis that a such Mandate will be beneficial to the seller in procuring interested buyers and implicit in this is that they will deal with a select group of experienced and reputable estate agents to the exclusion of others, and that the property will sell at a market related price.
When it markets its services to buyers, it does so with the view to securing offers to purchase which are market related in relation to properties on their books, having regard to the actual condition of such properties, which offers it can then present to sellers.
3. WHAT DOES 'FAIR AND RESPONSIBLE' MARKETING OF ESTATE AGENCY SERVICES ENTAIL?
The marketing of an estate agent's services and the marketing of the properties listed with estate agents pursuant to the mandates that have been signed, are inextricably linked.
It is implicit that estate agents would provide potential buyers with reliable, honest and accurate information in relation to the properties it advertises and markets, and its services in relation thereto.
Every advertisement of a property in respect of which an agency has a mandate, carries the name and logo of the estate agency concerned, and will also often contain a reference to the website of the estate agency.
An estate agency professes to be an area expert of the properties on their books, and market assessments are carried out by agencies within a particular area on that basis.
In order to find a 'willing and able' buyer for a property, the property must be correctly priced.
In order for an agent to correctly price a property, an agent must conduct a thorough inspection of the property, and familiarise him or herself with every aspect of the property – including any defects the property might have as it may affect the price and it may influence the buyer in putting in an offer.
4. CONSEQUENCES OF A FAILURE BY AN ESTATE AGENT TO ACT FAIRLY AND RESPONSIBLY IN THE MARKETING OF ITS SERVICES
If an estate agency fails to conduct a thorough inspection of a property, and markets a property at a certain price in circumstances where it later turns out that there were major undisclosed defects to the property which were easily determinable by a qualified and experienced agent, the estate agency will most certainly be exposed to potential claims from the buyer – such claim will not be based on any contract with the estate agent (or the sale agreement itself), but it will be based on the estate agency's failure to adhere to the standard of conduct which it professes to uphold (and which the market demands) in relation to the delivery of its services as an estate agent.
The seller of the property may still enjoy the protection of the 'voetstoots' clause in the sale agreement as the seller is not bound to the CPA – and this may leave the estate agency concerned wide open to potential claims from a dissatisfied buyer where no effort was made to check for defects.
5. DECLARATIONS BY SELLERS TO DISCLOSE DEFECTS – HOW DOES THIS PROTECT AN ESTATE AGENCY?
The so-called Seller's Declaration protects the estate agent against potential claims, in the following manner:
- The market assessment by the agent is now based on accurate information and no misrepresentation is made with regard to the inherent value of a particular property;
- The seller is forced to apply his or her mind to the condition of their property, and to disclose any defects they may be aware of to the agent, prior to the marketing of the property, or the marketing of the estate agency's services in relation to that or other properties;
- The agent will ensure that their marketing and advertising activities are aligned to the actual condition of the property and that defects are either attended to prior to the sale taking place, or that the purchaser takes possession of the property, well knowing the condition of the property which they are buying.
- It shows that the agent has taken reasonable care to ensure that it fulfils the expectation that was created in the market place, namely that it would provide a professional service;
- It creates an atmosphere of transparency and buyers know exactly what they are buying;
- The number of disputes arising from sale transactions are significantly reduced as it facilitates the resolution of disputes - both parties have a much clearer understanding of what was bought and sold;
- It protects both the listing agent and the selling agent as there is now a very clear description of the property and what may be excluded or included in the sale – sellers often (mistakenly) assume that information that was given to the listing agent has been passed on the selling agent.
A buyer should not succeed in any claim against the agent on the basis of false or misleading marketing or advertising where an agency has disclosed all defects they were aware of, or could reasonably have become aware of, prior to a sale taking place.
The relevant provisions of the CPA are as follows:
Consumers right to fair and responsible marketing:
General standards for marketing of goods or services
29. A producer, importer, distributor, retailer or service provider must not market any goods or services.
- In a manner that is reasonably likely to imply a false or misleading representation concerning those goods or services, as contemplated in section 41; or
- in a manner that is misleading, fraudulent or deceptive in any way, including in respect of—
- the nature, properties, advantages or uses of the goods or services;
- the manner in or conditions on which those goods or services may be supplied;
- the price at which the goods may be supplied, or the existence of, or relationship of the price to, any previous price or competitor’s price for comparable or similar goods or services;
- the sponsoring of any event; or
- any other material aspect of the goods or services
Consumers right to fair and honest dealing:
False, misleading or deceptive representations
41(1) In relation to the marketing of any goods or services, the supplier must not, by words or conduct
(a) directly or indirectly express or imply a false, misleading or deceptive representation concerning a
material fact to a consumer,
45(b) use exaggeration, innuendo or ambiguity as to a material fact, or fail to disclose a material fact if that
failure amounts to a deception, or
c) fail to correct an apparent misapprehension on the part of a consumer, amounting to a false, misleading
or deceptive representation, or permit or require any other person to do so on behalf of the supplier.
(3) Without limiting the generality of subsections (1) and (2), it is a false, misleading or deceptive representation
to falsely state or imply, or fail to correct an apparent misapprehension on the part of a consumer to the effect,
that
c) any land or other immovable property
i) has characteristics that it does not have;
ii) may lawfully be used, or is capable of being used, for a purpose that is in fact unlawful or
impracticable, or
iii) has or is proximate to any facilities, amenities or natural features that it does not have, or that are not
available or proximate to it.

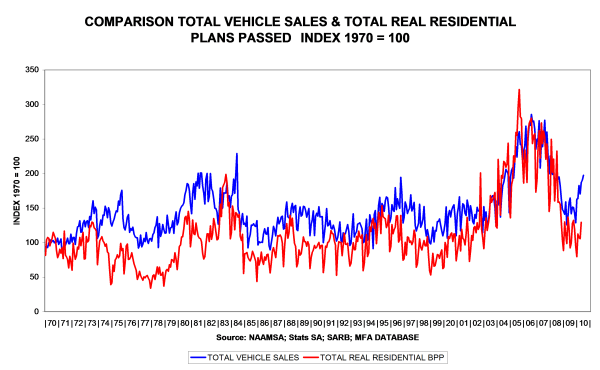
Leading Economic Indicators: Vehicle Sales & House Plans Passed: February 2011
Vehicle sales rose from 38 071 in Jan 2010 to 45 135 in Jan 2011, a solid performance.
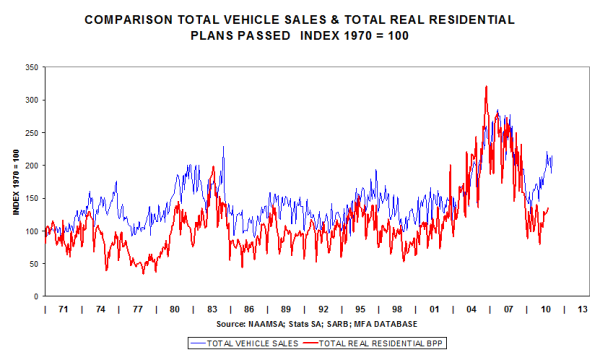
The percentage movement in vehicle sales is conforming to pattern and is expected to moderate during the year because of the higher base recorded in 2010.

Vehicle sales are buoyant, but house plans are lagging.
The sharp improvement in house plans passed is taking a breather.

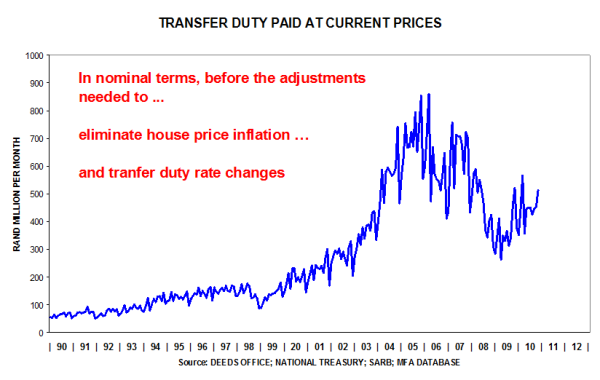
The level, in nominal terms, is recovering.
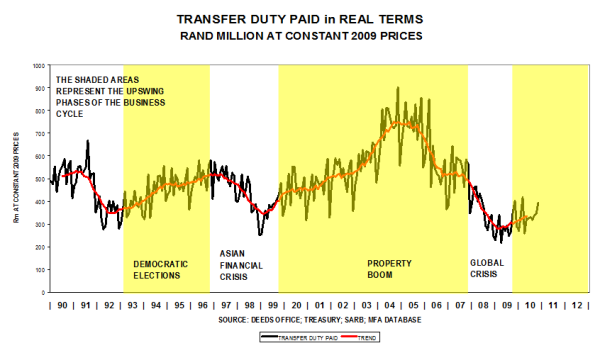
After eliminating inflation, the real level shows a steady improvement.
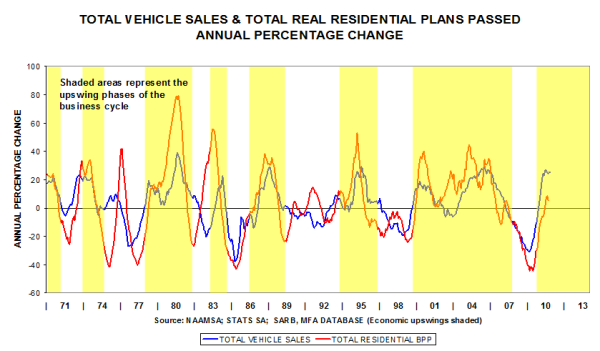
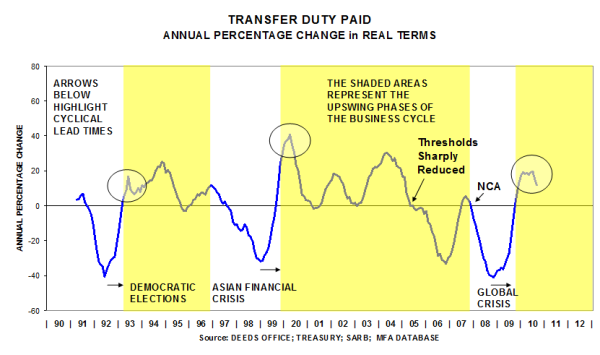
The annual percentage movement is conforming to pattern … first, rising rapidly, then moderating during the early part of the growth phase (refer circles).
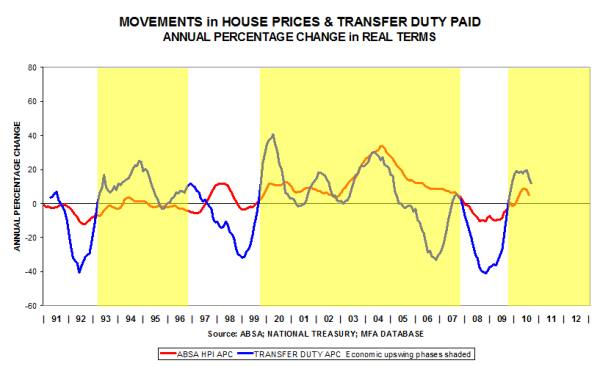
House price movements feed into the values of property transactions, on which transfer duties are based, hence the correspondence in cyclical movements. The activity series is more volatile than the price series because of significant changes in the underlying numbers of property transactions.

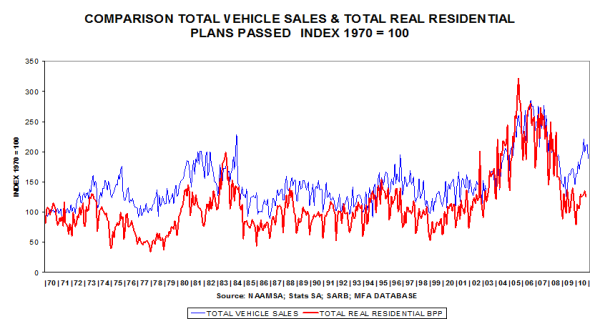
SARB Leading Indicator, Vehicle Sales, Transfer Duty & House Prices
The SARB leading indicator dropped marginally, possibly reflecting some moderation in the economic growth rate …
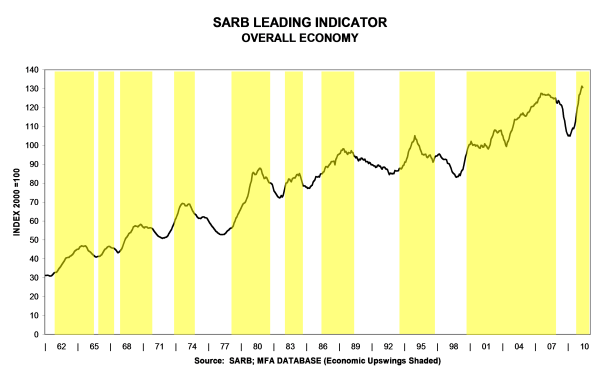
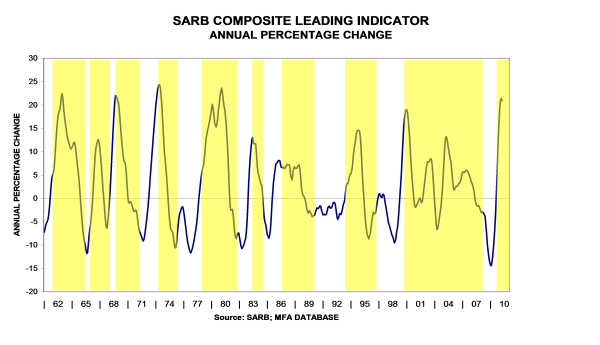
… yet, the annual percentage increase is very high because of comparative base effects (i.e. current levels are being compared to very low levels a year ago)
Vehicle sales have benefited from World Cup purchases and comparative base effects … the time series plans passed is forming a trough.
In percentage change terms, vehicle sales are performing well (+23% year-on-year), partly because of comparative base effects. In the near future this leading indicator is expected to moderate as higher current levels will be compared to higher levels a year ago

The trend in the residential property market is still upward …

… yet, in real terms, the revival is not as robust as was the case in 1999 because mortgage finance is currently scarce

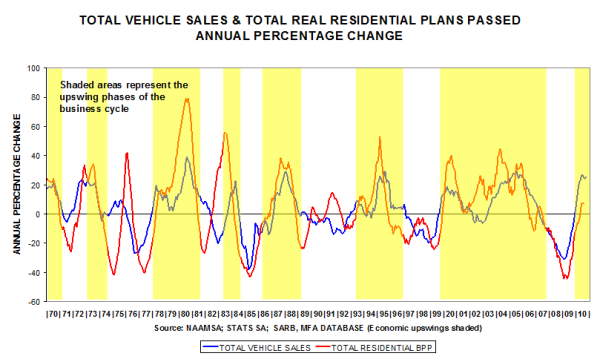
In percentage change terms the rise is conforming to pattern. Note that early in the upswing phase of the business cycle the growth rate is robust, but as can be seen in the circled areas, after a while it tapers off.

Nominal house price increases are taking a breather

Real house prices are still below their peak levels in 2007

Even though the time series Transfer Duty Paid is more volatile than House Prices, they seem to reflect similar trends – currently positive, but both moving sideways


In this month’s MFA newsletter we focus on the lending criteria of banks in South Africa and trends in new housing. This research was prompted by a question raised in Johannesburg during the recent BMI Forum.
It is known that various factors are interrelated in the private housing market.
Some interrelated factors:
- Interest rates
- Banks’ lending criteria (easy or strict or very strict)
- Building loans (the availability of money for new housing)
- Residential building plans passed (private sector)
- Investment in the private residential sector
- House prices
- New housing investment and the household debt ratio
- Changes in the household debt ratio
The Bureau for Economic Research has been monitoring the lending criteria of banks in South Africa since 2002. This quarterly research is sponsored by Ernst & Young. The question in the BER survey is posed in a manner to elicit a response of “easy, strict, or very strict”. This indicator varies between zero and 100. If all of the respondents say “easy”, then the line in the graph would be at zero. If all respondents say very strict, then the line would be at 100. One observes the following cyclical course of this useful economic indicator:
- Strict lending criteria in 2002 and 2006/07
- Easy criteria during 2004/05
- Very strict criteria were applied during the global financial crisis in 2008/09

The Cost of Money
In the next slide the prime interest rate level is compared to banks’ lending criteria.
Observe the general correspondence, that “lending behaviour is strict when interest rates are high”. In 2002, when interest rates were high, lending criteria were strict. When interest rates dropped in 2003/05, lending criteria were relaxed. When interest rates rose in 2006, lending criteria became stricter. At the peak of the interest rate cycle in 2008, lending criteria were very strictly applied as banks clamped down on credit advances.
These trends are a reflection of the economic reality that when the price of capital (the interest rate) rises, the commodity (money) becomes scarce.

The Availability of Money
Our next slide shows the movements in the availability of money (i.e. building loans), expressed as an annual percentage change (APC). Please note that the scale of the lending criteria has been inverted. This is done to highlight the coincidence of turning points in the data. Recall that interest rates rose during 2002 after the rand exchange rate crisis in 2001. Consequently, the APC of building loans dropped from mid 2002 to mid 2003. When interest rates started to drop and the lending criteria of banks were relaxed in 2003 to 2005, the APC of building loans soared by almost 70% during 2004. In the period 2006 to 2009 lending criteria became very much stricter and the APC of building loans hit bottom at -65% year-on-year. This happened in the same quarter as lending criteria recorded a turning point.
Since the middle of 2009, lending criteria have been relaxed, and the APC of building loans has started to bottom out..

In our next slide the annual percentage change in the real value of total residential plans passed is compared to the lending behaviour of banks. Please note that the scale of the lending criteria has been inverted. This is done to highlight the coincidence of turning points in the data. Observe that there is a positive relationship, when portrayed in this manner. For example, when lending criteria were relaxed in 2003/05, plans passed were strongly positive, rising by as much as 40% year-on-year in early 2004. When lending criteria became stricter in 2006/07, plans passed became negative, relative to a year ago.
When about 95% of the respondents reported very strict lending criteria in 2008 at the time of the global financial crisis, plans passed were about 40% lower than a year ago – the coincidence of turning points is striking. With lending criteria becoming more relaxed in 2010, the slowdown in housing has started to moderate. This slowdown is expected to bottom out in 2010.

The following slide shows the close correspondence between the annual percentage change in total real residential investment and the lending behaviour of banks. A positive relationship emerges (scale of lending is inverted). Observe that investment rises by as much as 35% year-on-year in 2005, following on the easier lending conditions prevailing during 2004. Investment became negative in 2007, more or less at the time that the National Credit Act was introduced. This Act restricted lending by banks. Investment continued to drop in 2008/09 as lending criteria became very stringent during the global financial crisis.
With the relaxation of the very strict lending criteria in late 2009, it seems as if the residential market could bottom out during 2010.

The next slide shows the close correspondence between the movements in house prices and the lending behaviour of banks. Again, a positive relationship emerges, when portrayed in this manner. Thus, it can be seen that when lending criteria were relaxed in 2004, house prices rose by as much as 35% year-on-year. When lending criteria became very strict in 2008, house price increases became negative in 2009. With the relaxation of lending conditions in 2009, nominal house prices started to rebound – they are already more than 10% higher than a year ago. The latter effect could be positive for new homebuilding because the higher the prices of existing houses, the greater the substitution effect with new houses becoming a viable alternative for expensive existing houses.

The following slide shows the relationship between the household debt ratio and real investment in total housing. The household debt ratio is defined as the amount of debt that individuals have incurred, divided by their disposable income. This is then expressed as a percentage. This debt ratio rose from 50% in 2002/03 to 80% in 2008. Observe that both investment and debt levels rose rapidly after 2003. This is a reflection of the economic reality that investment in new housing was largely fuelled by credit during the boom years 2003/06. The banks’ role in this boom is depicted in our final slide.

In our final slide, the trend in banks’ lending criteria is compared to the annual percentage change in the debt ratio. Observe that debt increased rapidly during the period 2003 to 2007. The percentage increases were significant, rising by between 10% and 15% per annum in most years. The household debt ratio only started to drop when lending criteria became very strict in 2008. The debt ratio could decline if debt decreases, or if disposable income rises due to above-inflation salary and wage adjustments. Such a move would lay the groundwork for a revival in new housing investment.
