

Transfer Duty July 2011
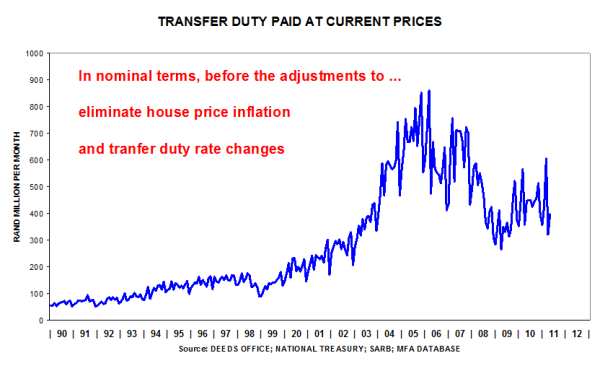
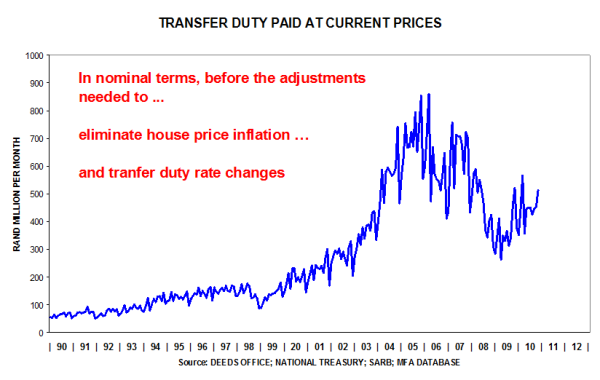
In nominal terms, May 2011 data were better than in April 2011, but the property market is still suffering from lack of mortgage finance from banks.
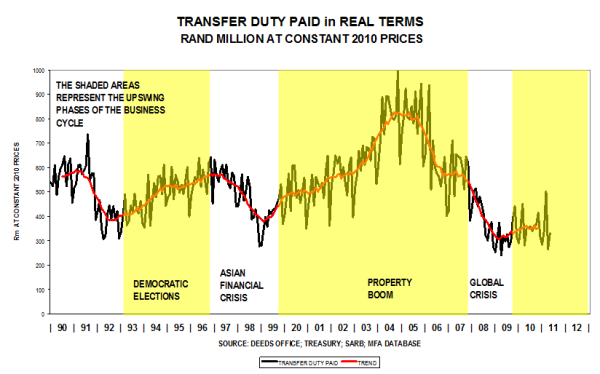
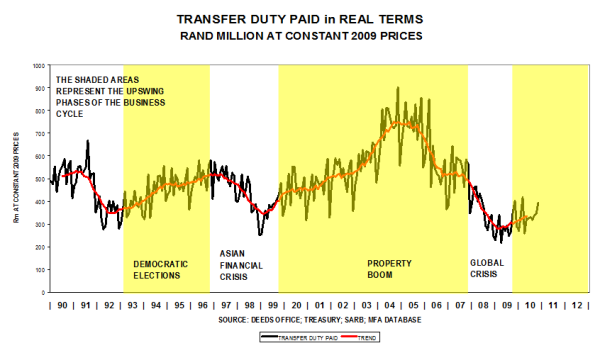
In real terms, the trend is virtually sideways.
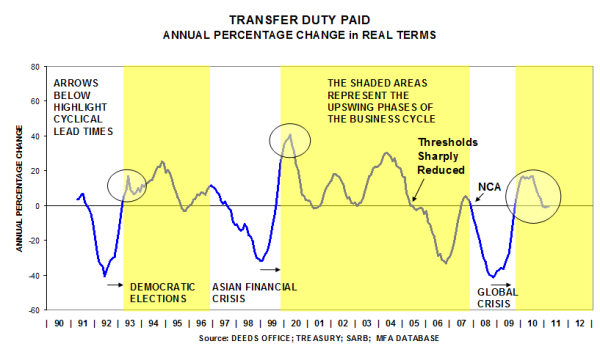
The annual percentage change is nudging the zero line, implying that real levels are the same as a year ago.

Cement Sales July 2011
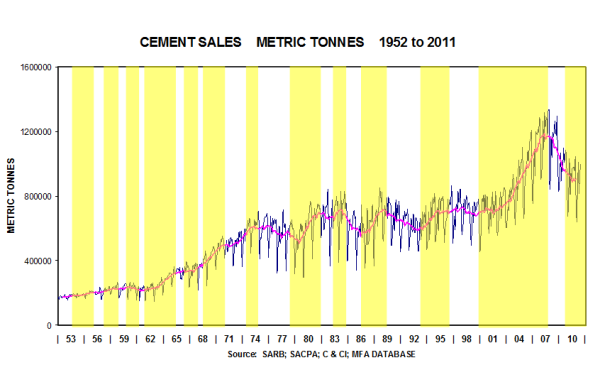
Cement sales were about 10% higher in June 2011 than in May 2011. The shape of the trend suggests that a trough in the cycle is at hand.
The year-on-year percentage change was zero in June 2011, suggesting that cement sales could grow during the second half of 2011.

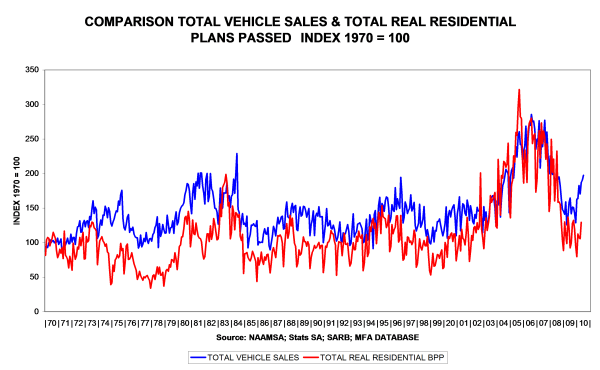
Leading Economic Indicators: Vehicle Sales & House Plans Passed: February 2011
Vehicle sales rose from 38 071 in Jan 2010 to 45 135 in Jan 2011, a solid performance.
The percentage movement in vehicle sales is conforming to pattern and is expected to moderate during the year because of the higher base recorded in 2010.

An Update of STATS SA data & Other Selected Leading Economic Indicators: December 2010
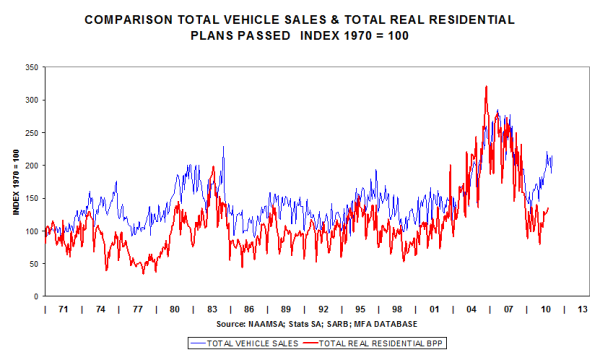
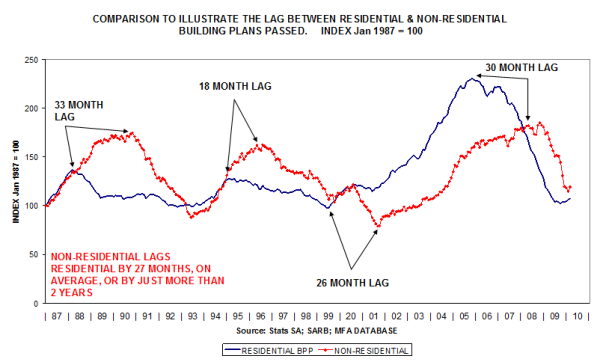
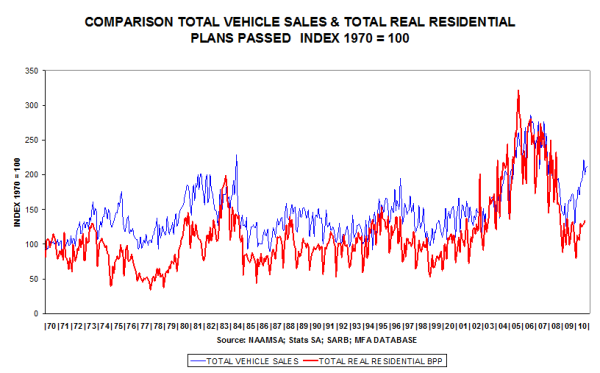
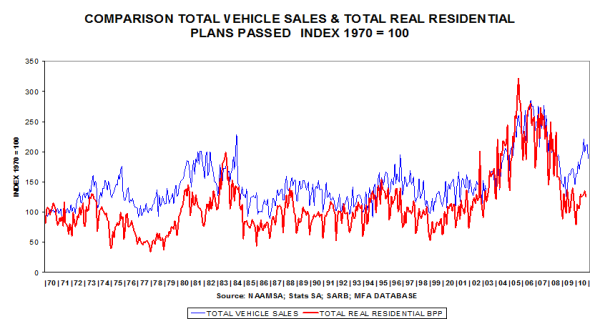
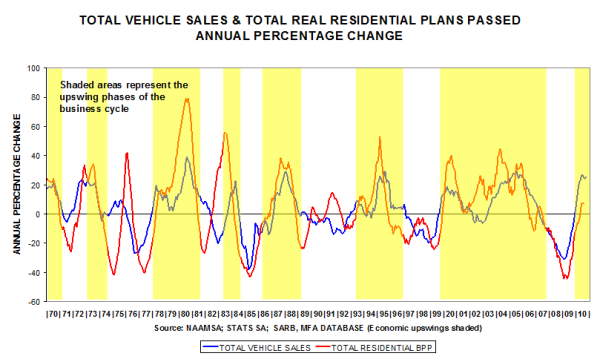
This comparison reflects “big ticket items” – vehicle sales and house plans passed – both are strongly cyclical and both are sensitive to interest rate movements. Belatedly, the residential sector is improving.
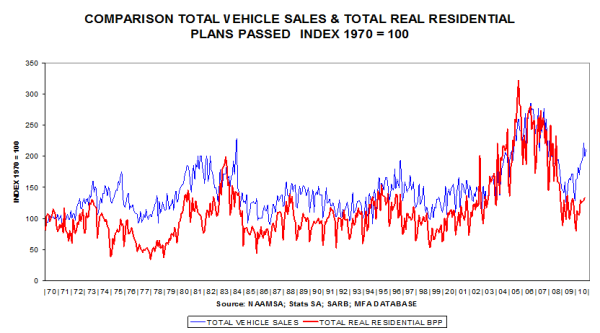
The cyclical movements correspond closely; vehicle sales are almost 25% higher than a year ago and houses are 7% higher in deflated value terms.
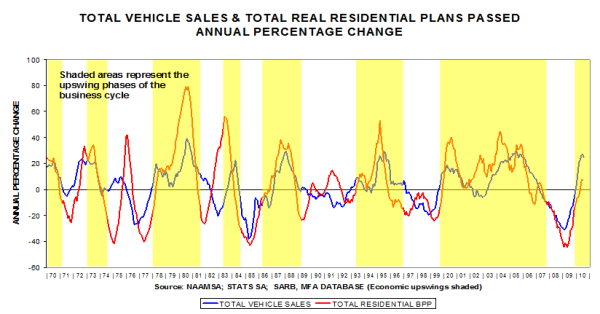
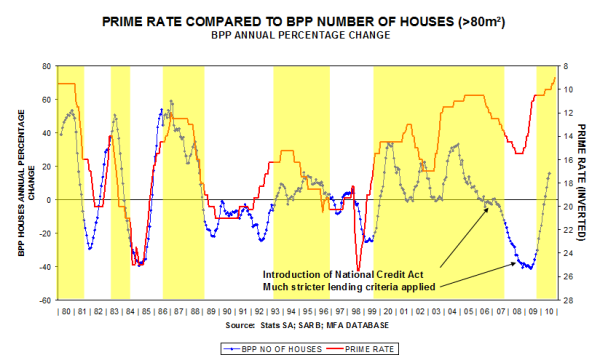
Two blows struck the private housing industry in 2007/08 but it seems to be responding belatedly to lower interest rates, currently showing a 15,8% rise over the past year (left-hand scale).
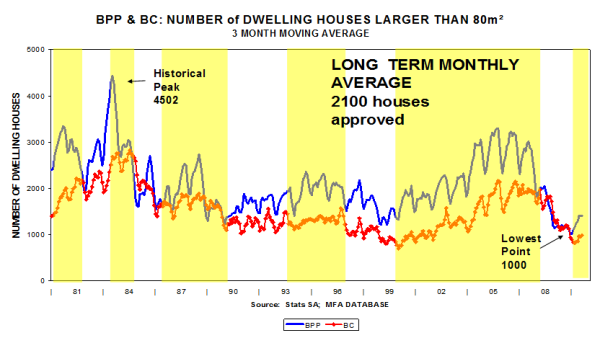
In terms of numbers, private housing is barely bouncing off the bottom.
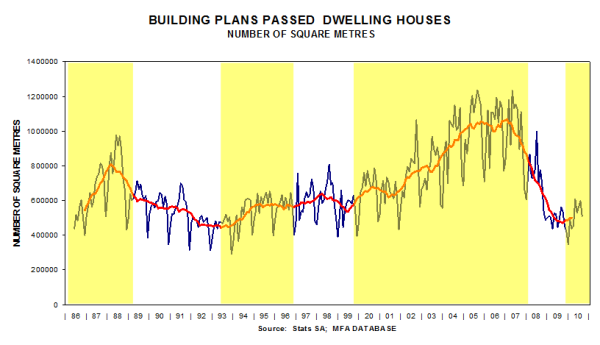
In terms of square metres, dwelling houses are bottoming out.
And townhouses and flats seem to be improving from very low levels.
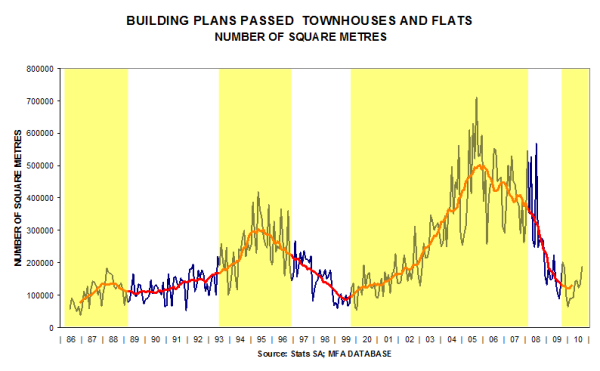
Still performing poorly but a bottoming-out is evident.
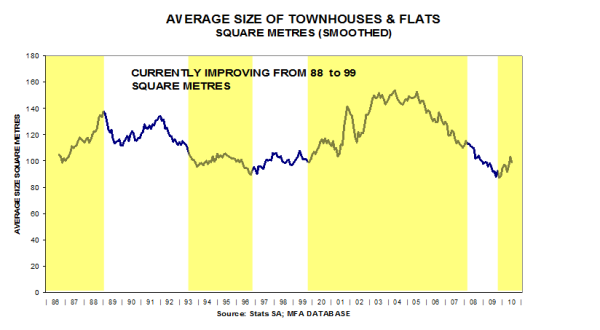
The gradual downtrend in the sizes of townhouses and flats seems to be reaching a lower turning point.
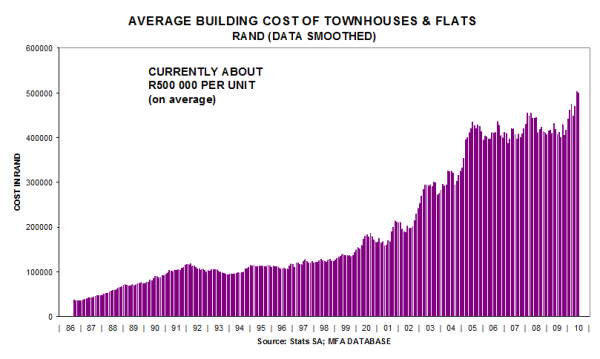
The building cost of townhouses and flats has recently risen to about R500 000 per unit.
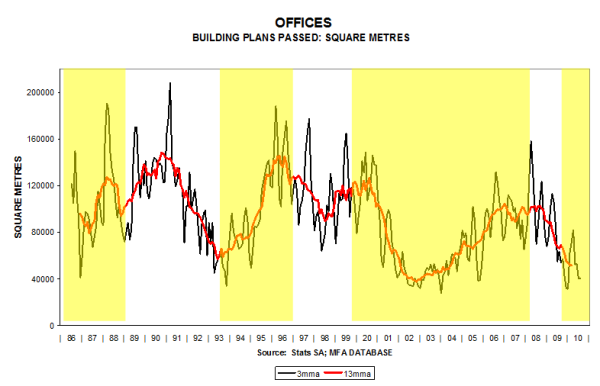
The demand for new office space has dropped to extremely low levels.
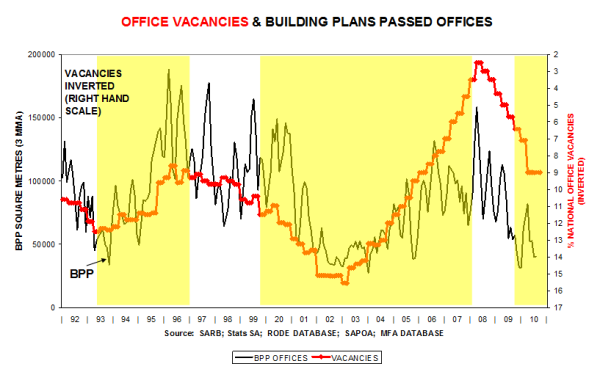
This is because office vacancies are still high on a nationwide basis (vacancies line inverted).
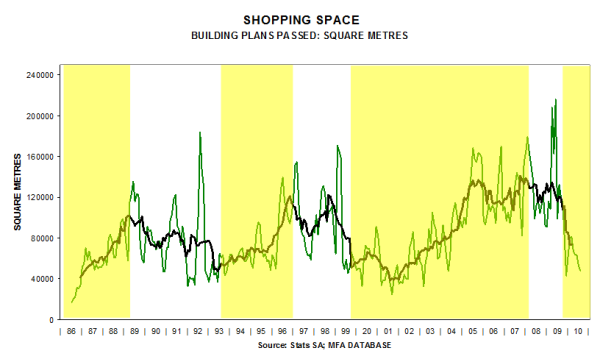
Further evidence of over-building.
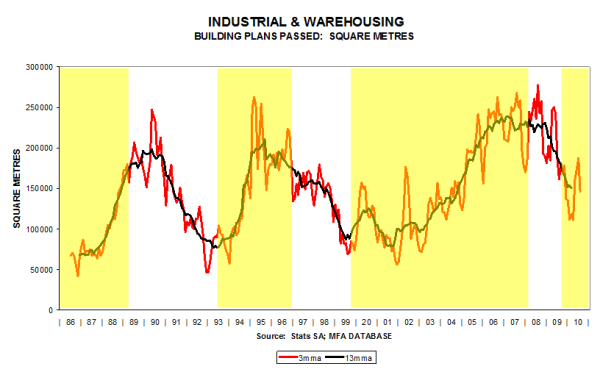
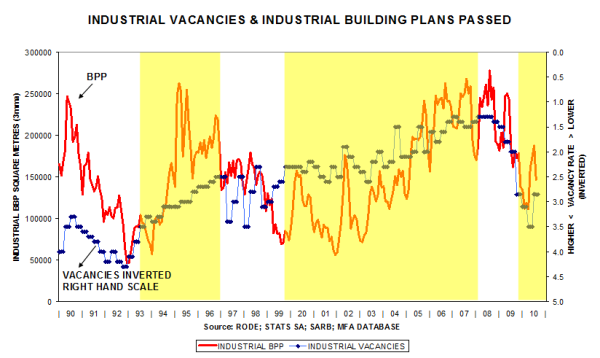
It is quite likely that the trough of the cycle has been recorded.
But industrial vacancies are still relatively high(vacancies line inverted).
A bounce back is evident.
Some improvement from a very low level is apparent.
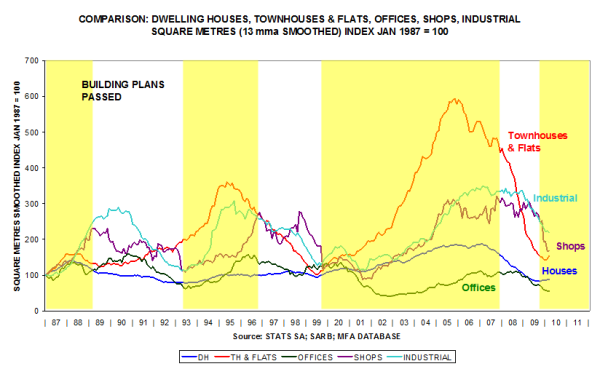
This comparison shows the relative performance of the various market segments since 1987. Houses, flats & townhouses showing signs of bottoming out.
This comparison shows the lagged pattern (residential is forming a trough, non-residential has further to fall).
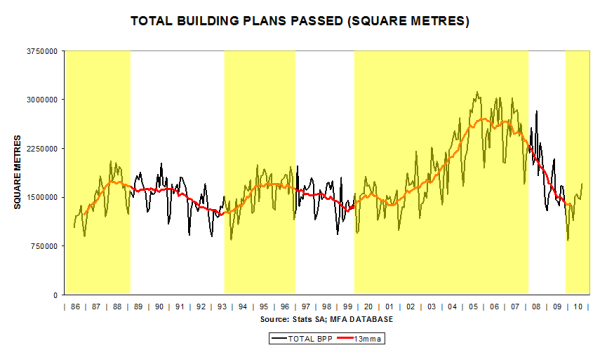
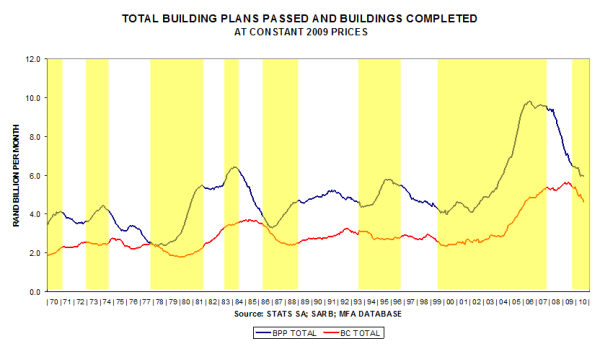
Building Plans Passed is bottoming out, and the lagging Buildings Completed time series is still tending downward.
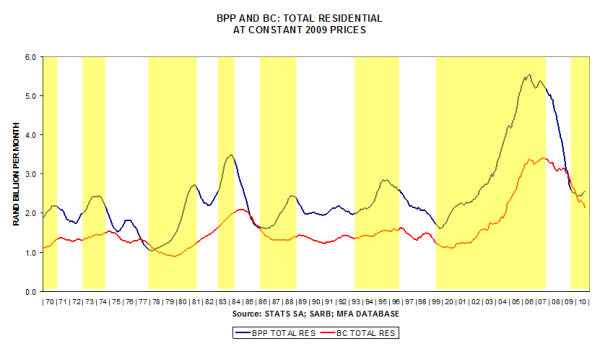
Both indicators have further to fall.
BPP could be bottoming out, BC not so.
In deflated value terms, it seems as if BPP total could be approaching a trough, but not so in the case of BC.

Prospects for Building & Construction Update of SA Reserve Bank and other data.
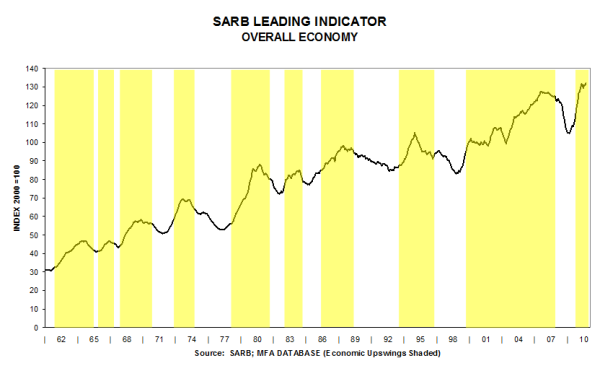
This key indicator is reflecting the slower growth rate in the macro-economy.
The vehicle market is outperforming the residential building market.
The vehicle market has had a burst of growth, but is now reflecting comparative base effects. It is conforming to the historical pattern.
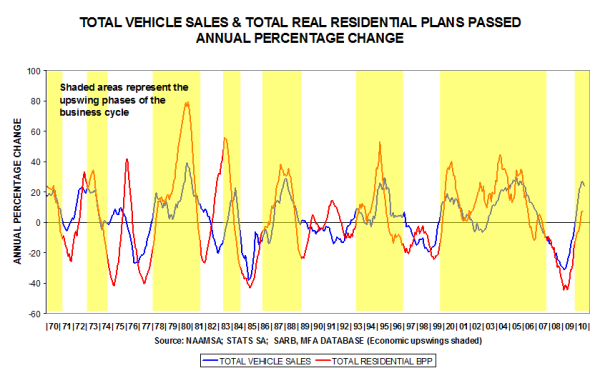
Private sector house plans passed are belatedly reacting positively to lower interest rates.
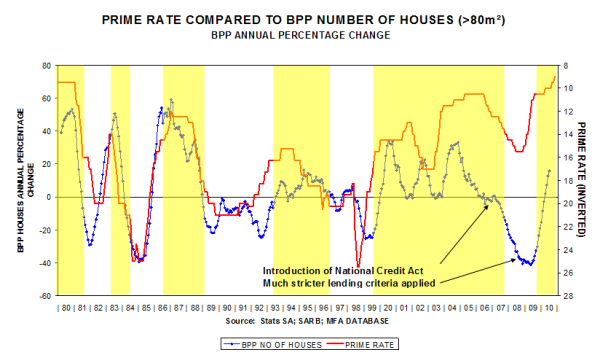
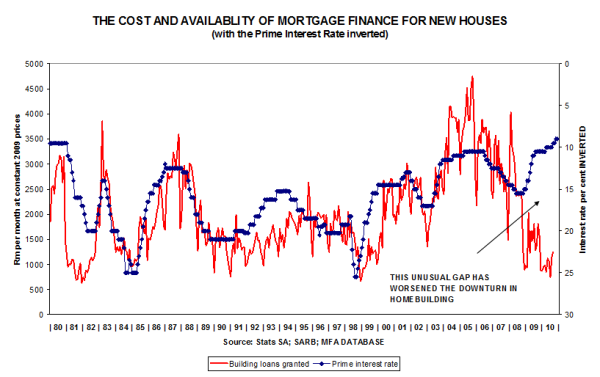
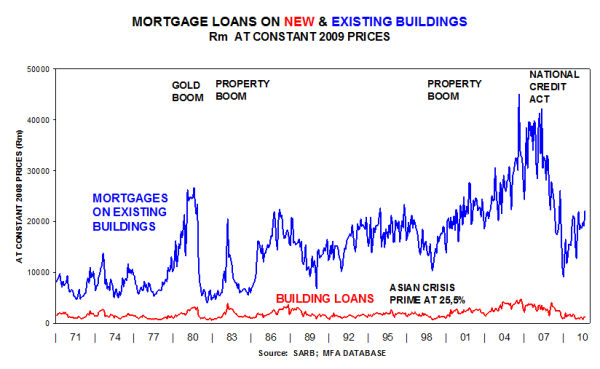
Mortgage loans for new houses have not yet responded positively to lower interest rates.
The cost of finance (the interest rate) has dropped, but the availability of housing finance is still bumping along the bottom. A possible reason could be the tight-fistedness of the banks.
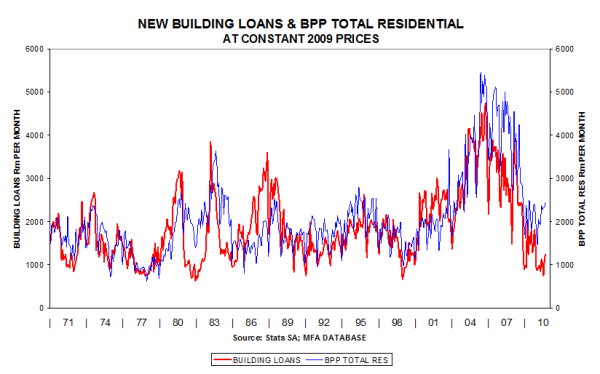
With the same value scales, it can be seen that residential plans passed have dropped less than building loans for new houses.
Mortgage loans for existing houses has staged a comeback, but not so in the case of new houses.
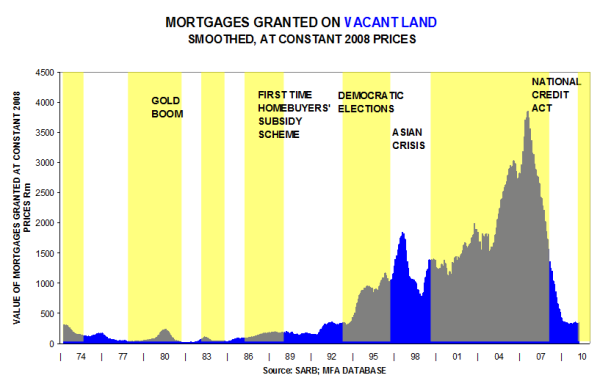
Mortgages granted for vacant land fell by about 90% from peak levels.
The commercial sector has dropped markedly.
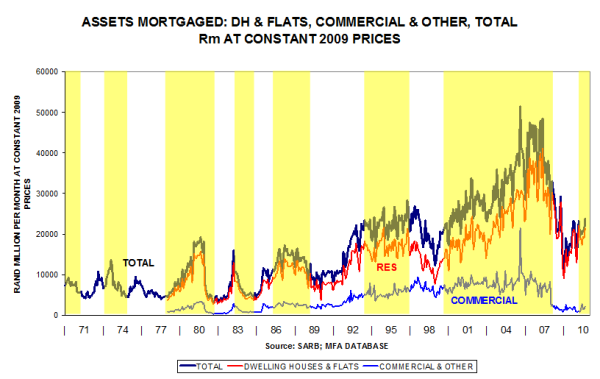
The peak was recorded in 2006, and 2010 could see the trough of the cycle.
Conforming to pattern with the downturn slowly bottoming out.
The housing boom, 1999 – 2006, was financed largely on rising debt levels. With debt levels still high, no robust expansion is in the offing, therefore we foresee modest growth rates in housing demand.
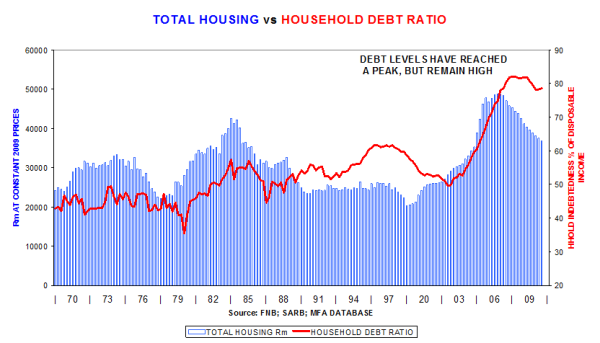
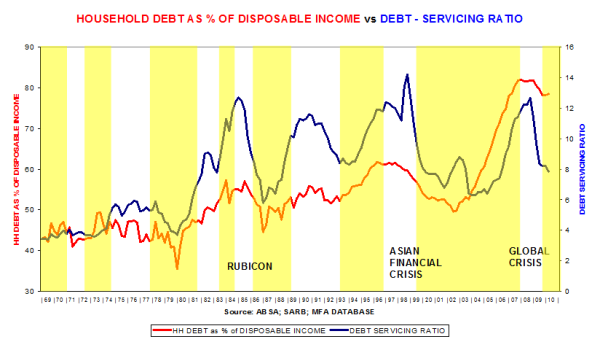
Debt servicing costs have declined because of a 6½ percentage point drop in interest rates, but debt levels remain high.
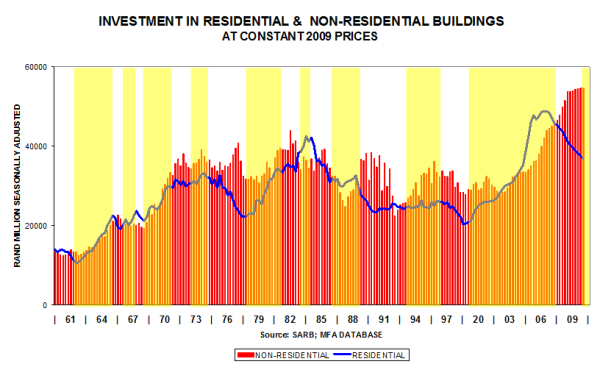
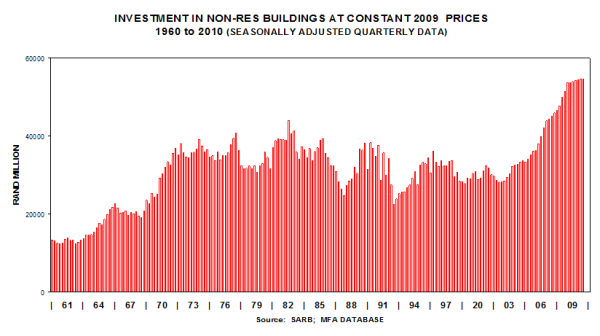
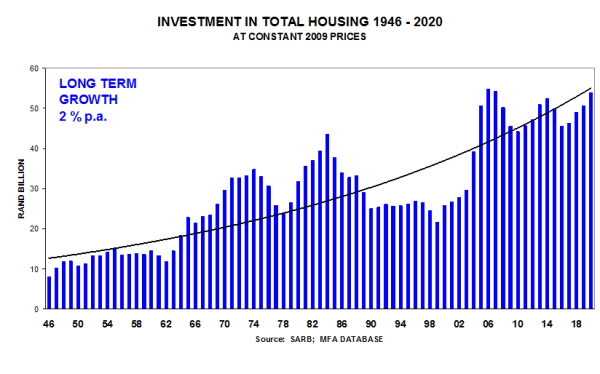
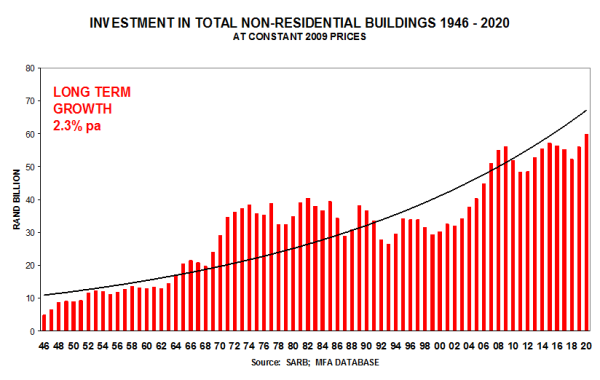
The housing market is currently smaller than the non-residential market (without taking the unrecorded housing sector into account).
SA Reserve Bank figures are recording a peak.
Conforming to pattern – still much further to drop from peak levels.
SA Reserve Bank figures show that a peak is being recorded.
With growth rates falling rapidly.
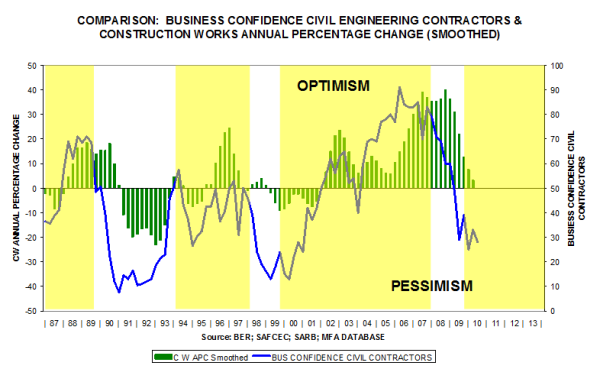
With growth rates in demand levels falling rapidly, civil engineering contractors are understandably pessimistic.
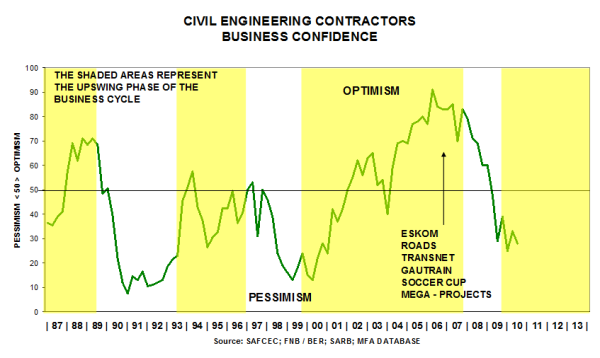
This graph below shows the close correspondence between declining activity levels and low business confidence.
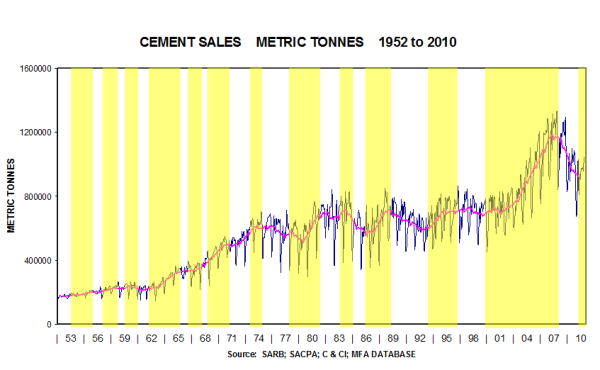
Cement sales data have been released after a year during which the Competition Commission was investigating the cement companies for market-sharing irregularities.
In future, the Cement and Concrete Institute will be allowed to publish cement sales data for South Africa only (excluding Botswana, Namibia, Swaziland, Lesotho and export sales). This required us to adjust the historical data to keep the time series consistent.
No regional sales data are no longer available – a great loss to economic researchers.
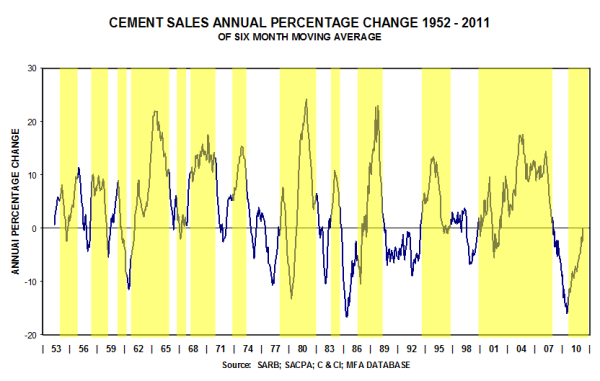
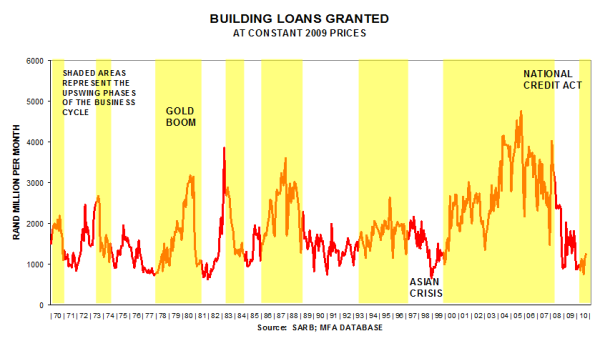
The accompanying MFA graph of the level of cement sales (1952-2010) shows how strong the upswing was during the recent construction boom. It also shows how severe the current downswing is. Indeed, volume sales have almost dropped back to the levels prevailing in 2004
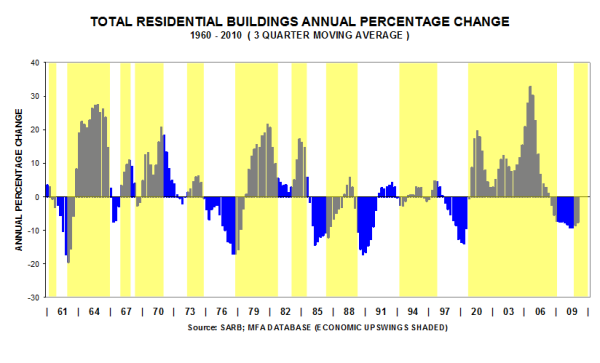
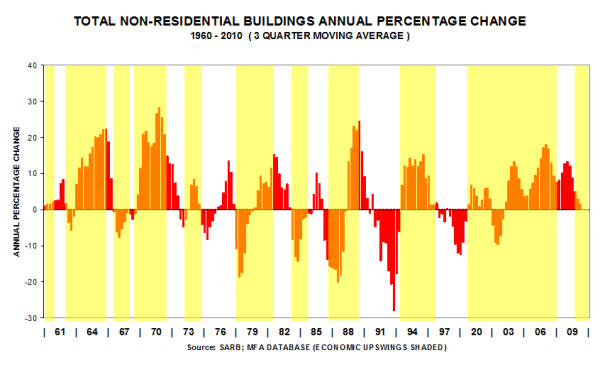
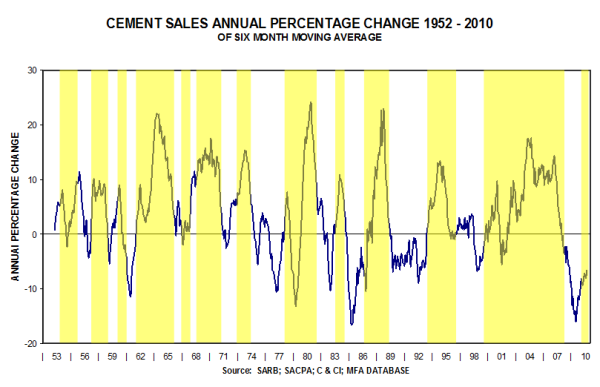
The graph of the year-on-year changes reflects two features: How regular the cyclical fluctuations are; and how severe the current downturn in sales really is. By comparison, volume sales have dropped in percentage change terms by as much as they did in 1985 at the time of the “Rubicon Recession”, i.e. by about -16% at its lowest point.
Cyclical swings are conforming to pattern and the current downturn is on a par with the 1985 recession.
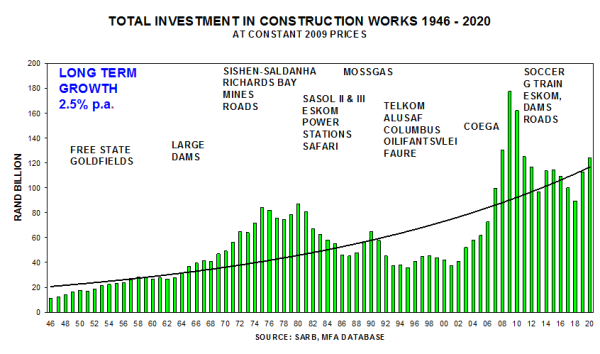
Long term view till 2020.

Vehicle sales are buoyant, but house plans are lagging.
The sharp improvement in house plans passed is taking a breather.

The level, in nominal terms, is recovering.
After eliminating inflation, the real level shows a steady improvement.
The annual percentage movement is conforming to pattern … first, rising rapidly, then moderating during the early part of the growth phase (refer circles).
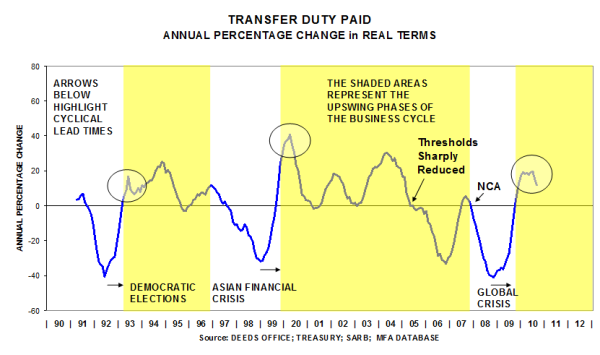
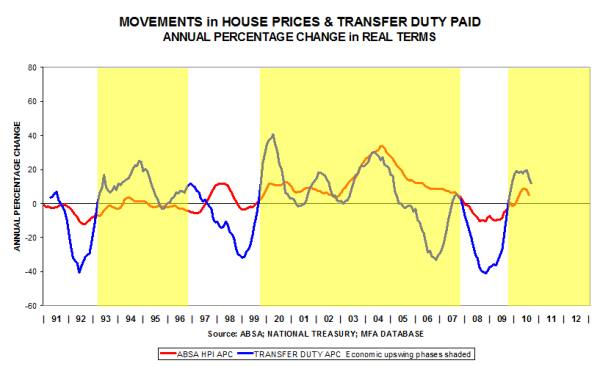
House price movements feed into the values of property transactions, on which transfer duties are based, hence the correspondence in cyclical movements. The activity series is more volatile than the price series because of significant changes in the underlying numbers of property transactions.

The famous economist, Lord John Maynard Keynes, taught us that economists should “study the present in the light of the past for the purposes of the future”. This is what forecasting economists do for a living. Keynes also cautioned economists “to be as humble as dentists”.
There were about 180 (fairly) humble economists attending the CIRET (Centre for International Research on Economic Tendency Surveys) economic conference. They came from 52 different countries. Why were they humbled, one might ask? Because none had foreseen the Great Recession that struck in September / October 2008, even as we gathered at the 29th CIRET Conference in Santiago, Chile, in October of that year. (Read more about the exceptional economists who actually did foresee the financial crisis in the Appendix to this Report).
Whilst economists had been humbled, they had not been idle during the intervening two years. Hence, several papers were read at the conference dealing with the development of leading indicators for the financial markets. Indeed, the theme of the New York conference was “Economic Tendency Surveys and Financial Markets”.
Business cycle analysis The keynote speaker, Prof Francis X. Diebold of the University of Pennsylvania, read a paper entitled “Real-time Macroeconomic Monitoring” in which he focused on “nowcasting” as opposed to “forecasting”. Nowcasting, also known as “real-time forecasting”, is aimed at determining at which point you find yourself in the business cycle. This is a familiar challenge facing economic forecasters and lends credence to the business surveys undertaken regularly by the members of the CIRET organisation. The research of Prof Diebold is focused on helping real people make real decisions in real time. He stressed the fidelity of the time series data used in economic analysis and pointed out that statistics with a higher frequency are generally more useful in real-time forecasting. Thus, data available on a daily basis would be more useful for real-time forecasting purposes than quarterly data that lag by three months. Prof Diebold also mentioned that his quest was to find, from a multi-data set, five to eight reliable factors underlying the course of the business cycle. In response to a question whether the US economy had undergone a structural change during the recent Great Recession of 2008/09, he answered that he believed that “this business cycle was not different, but it was certainly severe”.
Overall, about 110 papers were delivered on topics dealing with the methodology of business surveys, coincident and leading economic indicators, economic tendency surveys and financial markets, consumer tendency surveys, real-time monitoring and forecasting, innovative activity and econometric models. Several papers of special interest to South African readers are mentioned here. The first dealt with the weighting system applied to the responses of participants in surveys undertaken by the Bureau for Economic Research. It was found that with different weights allocated to different size firms, the results differed only marginally. A researcher from the South African Reserve Bank developed a composite leading indicator for dating business cycles in the SA manufacturing sector. A researcher from Taiwan showed how to improve the timeliness of turning signals in the business cycle by using monthly data. This highlights the importance of key leading indicators tracked by MFA on a monthly basis (e.g. vehicle sales, building plans passed and the SARB composite index of leading indicators).
An interesting paper was presented by Dr Richard Curtin, Director of Consumer Surveys at the University of Michigan. Using data from a consumer study undertaken in 2007 and comparing it to a follow-up study in 2009, he found that consumers’ knowledge about  economic tendencies, derived from the newspaper and TV media, improved only slightly during a time of financial crisis. The 2007 study found 34 national newspapers with a circulation above 400 000 daily copies. In the 2009 study, only 27 national newspapers could be found with a daily circulation above 250 000. One conclusion: the number and circulation of daily national newspapers is dropping in the USA. Another interesting fact: contrary to common belief, the CNN and Fox news channels constitute only 13% of total TV viewership in the US. Finally, the conclusion Dr Curtin came to was that the majority of consumers gather their knowledge of economic tendencies (e.g. inflation, unemployment) from private sources (e.g. price increases in supermarkets, a neighbour who was retrenched). One of the startling findings was that US consumers as a group could generally forecast the future inflation rate more accurately than economic forecasters in the US!
In the conference sessions relating to tendency surveys and financial markets, several researchers focused on developing leading indicators to identify asset bubbles ahead of time. An Italian researcher from the European Central Bank presented a paper entitled: “Trusting the Bankers: A New Look at the Credit Channel of Monetary Policy”. It was shown that the lending behaviour of banks fluctuates over the course of the business cycle. This paper is of special interest to us in the SA housing sector because we know that the two most important drivers of housing demand are mortgage rates and the availability of mortgage finance. Homeowners should be made aware of this to avoid hardship during a credit crunch. Referring to the housing bubble in Spain, an economics professor from Madrid showed that economists in the private sector and in government departments missed the onset of recession in Spain, even though the downward trend in key economic indicators was staring them in the face. He explained that “no one wants to be a party pooper!”
Comment
Attending this conference was certainly worthwhile. It focused on business cycle analysis, theory, measurement and practice. With multiple sessions running concurrently, it was not possible to attend all the presentations spread out over three days. Nevertheless, as most conference-goers would admit, the great value of such gatherings is found in the networking that takes place amongst like-minded people in the same profession. If there is one aspect that deserves special attention, it is this: too few researchers at the CIRET conferences relate their research findings to issues surrounding economic policy and decision-making. As Keynes said, by implication, one should not just study the past, but also learn from history to make wise choices about the future.
Appendix
1 Points to ponder
The following question usually arises during a severe economic recession: Is there a structural change in the macroeconomy, or is it (just) a severe cyclical downswing? This is an issue familiar to forecasting economists with a long memory. Take, for instance, the years 1975 -1977 in South Africa. At that point the country was experiencing its worst recession in post-war memory. Negative factors contributing to the recession were, inter alia, the drop in the gold price in 1974, the political upheaval caused by unrest in Soweto (1976) and subsequent trade boycotts. That it was not a structural adjustment in the economy, but rather a severe cyclical downturn, emerged later on when the gold price rose sharply and the economic growth rate soared to 6.6% on average in 1980. By contrast, the downfall of communism in 1989, the slashing of import tariffs and the growth of globalisation could rightly be described as structural changes affecting the South African economy. The 1989/93 cyclical downswing in the economy was protracted, but not as severe as was the 1975/77 recession. The 2008/09 cyclical downswing in the South African economy has been particularly severe and people are again asking whether structural change has taken place.
Economists are asking the same question about the US economy. The fears arise as jobs are being lost, first to Mexico, now to China. The motor industry in Detroit has suffered severely. Ironically, the casino industry in that region is growing. Here is a perspective of where the US is headed. In May 2008, the author of this Report visited Delaware where a large Chrysler plant had been closed down, with the factory and staff parking lot the size of many rugby fields totally deserted, not even a security guard at the gate. This factory produced roughly 300 000 vehicles per year, about the same number of vehicles sold in South Africa per annum. The latest news from this part of the world is that the local University of Delaware has purchased this commercial space for future expansion. This finding illustrates that the importance of the manufacturing industry in the US is declining and that the contribution of the service sector (the knowledge-based economy) is growing.
2 Two economists who got it right
We turn now to two exceptional economists who actually did predict the financial crisis of 2008/09 ahead of time. The first, and most famous of the two, Nouriel Roubini, is a professor at New York University, situated in lower Manhattan. According to an interview in the Financial Times (9 May 2010), he gave an important speech to the IMF in the (northern hemisphere) autumn of 2006, whilst the world economy and credit markets were booming.
 He warned that the “United States was likely to face a once-in-a-lifetime housing bust, an oil shock, sharply declining consumer confidence and ultimately a deep recession”, along with “homeowners defaulting on mortgages, trillions of dollars of mortgage backed securities unravelling and the global financial system shuddering to a halt”. Roubini repeated his warnings at the World Economic Forum meeting in Davos, Switzerland, in January 2007. We now know that Lehman Brothers folded in September 2008, tipping the global economy into financial crisis. Prof Nouriel Roubini achieved celebrity status.
The other notable economist who can claim to have got things right before disaster struck is Robert Shiller, a Yale University economics professor. According to Wikipedia (accessed 3 Nov 2010). Shiller co-authored a 2003 Brookings paper, "Is There a Bubble in the Housing Market?". Shiller subsequently refined his position in the 2nd edition of his book called Irrational Exuberance (2005), acknowledging that “further rises in the [stock and housing] markets could lead, eventually, to even more  significant declines. A long-run consequence could be a decline in consumer and business confidence, and another, possibly worldwide, recession. This extreme outcome … is not inevitable, but it is a much more serious risk than is widely acknowledged.” Writing in the Wall Street Journal in August 2006, Shiller again warned that "there is significant risk of a very bad period, with slow sales, slim commissions, falling prices, rising default and foreclosures, serious trouble in financial markets, and a possible recession sooner than most of us expected.” Shiller is famous for the Case-Shiller index of house prices in the US, widely quoted and used by analysts and policy-makers.
3 General observations 3.1 A highlight of the conference was being addressed by Paul Volcker, 83, the Chairman of the Federal Reserve under United States Presidents Jimmy Carter and Ronald Reagan (from August 1979 to August 1987). Since February 2009, he has been Chairman of the Economic Recovery Advisory Board under President Barack Obama. Volcker's Fed is widely credited with ending the United States' stagflation crisis of the 1970s. Inflation, which peaked at 13.5% in 1981, was successfully lowered to 3.2% by 1983. Volcker has been known to defy the stereotype of a Wall Street insider. A profile in The Week magazine for February 5, 2010, claimed that Volcker doesn't even buy the conventional wisdom that "financial innovation" is necessary for a healthy economy. In fact, he likes to say, "The only useful banking innovation was the invention of the ATM." At 6 feet 7 inches tall, and despite his advancing years, he remains an impressive and formidable character.
3.2 Where does the name Wall Street come from? The delegates at the conference were hosted by the Federal Reserve Board for dinner, just a stone’s throw from Wall Street. According to our guide, the Dutch colonized Manhattan in the sixteen hundreds. They built a real wall to keep out the local Indians … and the British!
3.3 Having visited New York in 1979, 1981 and 1982 during doctoral study tours, the author of this Report feels that he is able to compare New York in the early eighties with the city as it appears today. The improvement is vast! Mayor Ed Koch was threatening to imprison people with unlicensed guns in 1979, Mayor Rudolph Giuliani actually did clean up the city in subsequent years and Mayor Bloomberg seems to be following Giuliani’s lead. There is definitely one thing Mayor Bloomberg should do, viz. spend more money on fixing the uneven sidewalks; you could so easily break your toe.
3.4 As readers may be aware, New York is known for its wonderful plays on Broadway. Times Square, all hustle and bustle, is where you queue for an hour or two to obtain “half price” tickets, but beware, when on the way to the theatre on a rainy evening, the umbrellas come out, and watch out for your eye!
3.5 Construction is gathering pace at Ground Zero, now known as Memorial Plaza, where the Freedom Tower is to be built. In other parts of Manhattan there are many older buildings being refurbished. The scaffolding causes congestion on the sidewalks (see 3.4 above), but in typical American business tradition, boards are erected on the sides of the scaffolding … and the space is rented to advertisers.
3.6 Conclusion: What is the benefit of the CIRET conference for MFA and its clients? There are several benefits. Networking has already been mentioned. Secondly, the benefit of keeping up with trends in business cycle research. Thirdly, for MFA and its client base, the knowledge that our approach to business cycle analysis, which entails the integration of qualitative and quantitative data sources, is widely accepted and practised in developed countries. In this way we are always improving our forecasting ability to benefit MFA clients in their own business decision-making.
Sources
Heilbroner, Robert. 1972. The worldly philosophers. The lives, times and ideas of the great economic thinkers. 4th ed. New York: Touchstone Simon & Schuster.
Tett, Gillian. 2010. Interview with Nouriel Roubini. Finacial Times Life & Arts Section. London. 9 May, p3.
Wikipedia, The Free Encyclopedia. Accessed on 3 November 2010. Robert Shiller, Yale University economist.
Wikipedia, The Free Encyclopedia. Accessed on 3 November 2010. Paul Volcker.
Note: The local organising hosts were the New York based Conference Board, the body that compiles the monthly U.S. Index of Leading Economic Indicators. Visit their website www.conference-board.org/ to learn more about this leading economic research organisation.
If you would like to learn more about CIRET, please visit their website www.ciret.org

Dr Johan Snyman (on right) with Dr Gernot Nerb, Head of Surveys at the Ifo-Institute, Munich, colleagues and friends since 1982.

The residential sector suffered a severe downturn in 2008/09 because:
1. Interest rates were raised in mid 2006 to help combat inflation
2. The National Credit Act came in during July 2007, constraining lending
3. The global financial crisis struck in Sept / Oct 2008 and banks tightened their lending criteria quite severely.
In a research report, the J P Morgan investment bank calculated that the tightening of lending criteria had a similar effect on the housing industry as would have been the case if interest rates had risen by 3 percentage points. With interest rates having dropped by 5.5 percentage points since Dec 2008, this implies that the housing industry has effectively only benefited from a 2.5 percentage point drop in interest rates since Dec 2008. The net effect has been to deepen and prolong the homebuilding recession.
The latest June 2010 data were fairly similar to those for May 2010. It seems as if certain segments of the market are forming a trough.
Driving forces: The Cost of Money
Two blows struck the private housing industry in 2007/08 … but it seems that it is responding belatedly to lower interest rates as low current levels are now being compared to low levels a year ago:
")
Driving forces: The Availability of Money
This graph shows that – normally - mortgage finance rises when interest rates drop. Mortgage finance drops when interest rates rise. These mortgage finance data lag by three months, but it seems as if it has now hit rock bottom.

It seems as if BPP has hit rock bottom... currently 1 130

Dwelling houses are forming a through...

Townhouses and flats also seem to be approaching a trough at a very low level.

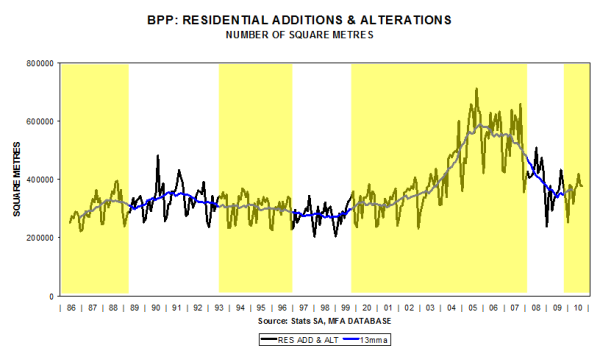
Another through in process?

Observe the gradual downtrend in sizes of townhouses and flats

The building cost of townhouses and flats seems to have stabilised between R400 000 and R500 000 per unit, with the potential to rise further from the current R450 000 per unit.

The demand for new office space has dropped to extremely low levels... could this segment also be forming a trough?

According to SAPOA, office vacancies have stabilised

Definate signs of over-building... still on downtrend:

With manufacturing production improving by almost 9% year-on-year in June 2010, could this be the trough of the Industrial cycle?

According to Rode & Associates, industrial vacancies seem to have stabilised

Little sign of improvement:

Could we be approaching the lower turning point in terms of square metres? Initial signs of a trough are evident:
")
Each segment needs to be compared to itself to identify long term cyclical trends: all are still downward, with townhouses & flats having risen and fallen most since 2009. Are square metres of houses bottoming out?

Total residential plans passed and buildings completed (in deflated value terms) are still performing poorly, but initial signs of a bottoming out are starting to appear.

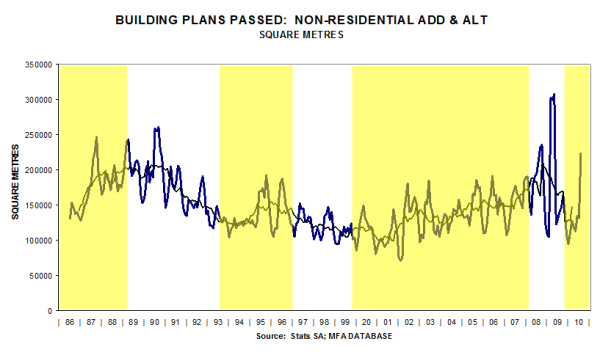
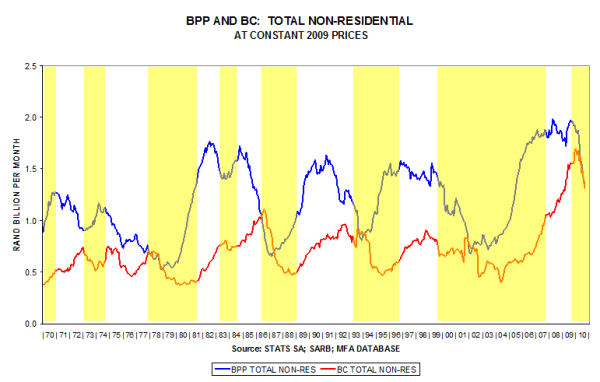
Non-residential BPP is expected to drop further in 2010/2011 and a revival can only be expected late in 2012:

BPP seems volatile, whilst BC is a lagging indicator that could drop further:

Both indicators are still performing poorly, but a drop in the early part of an economic growth phase seems part of the normal pattern.

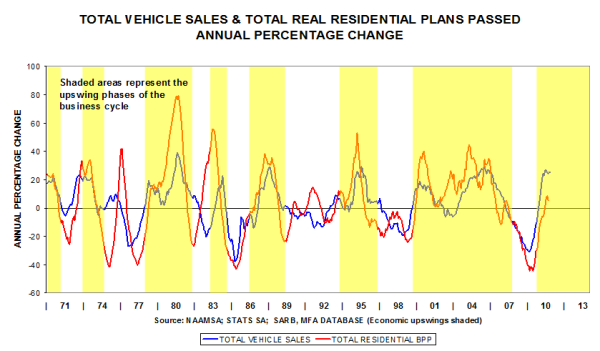
The lags evident in these indicators suggest that the residential sector could bottom out during 2010, but that the non-residential could still drop further.


SARB Leading Indicator, Vehicle Sales, Transfer Duty & House Prices
The SARB leading indicator dropped marginally, possibly reflecting some moderation in the economic growth rate …
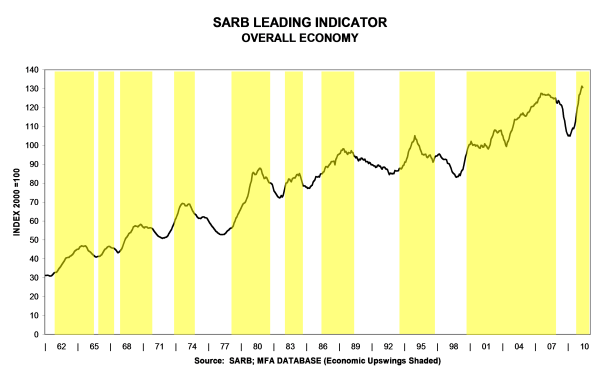
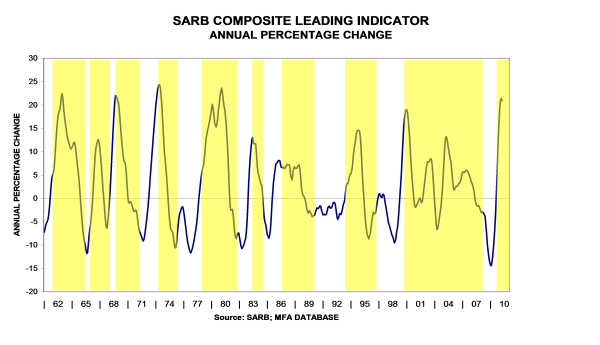
… yet, the annual percentage increase is very high because of comparative base effects (i.e. current levels are being compared to very low levels a year ago)
Vehicle sales have benefited from World Cup purchases and comparative base effects … the time series plans passed is forming a trough.
In percentage change terms, vehicle sales are performing well (+23% year-on-year), partly because of comparative base effects. In the near future this leading indicator is expected to moderate as higher current levels will be compared to higher levels a year ago

The trend in the residential property market is still upward …

… yet, in real terms, the revival is not as robust as was the case in 1999 because mortgage finance is currently scarce

In percentage change terms the rise is conforming to pattern. Note that early in the upswing phase of the business cycle the growth rate is robust, but as can be seen in the circled areas, after a while it tapers off.

Nominal house price increases are taking a breather

Real house prices are still below their peak levels in 2007

Even though the time series Transfer Duty Paid is more volatile than House Prices, they seem to reflect similar trends – currently positive, but both moving sideways
